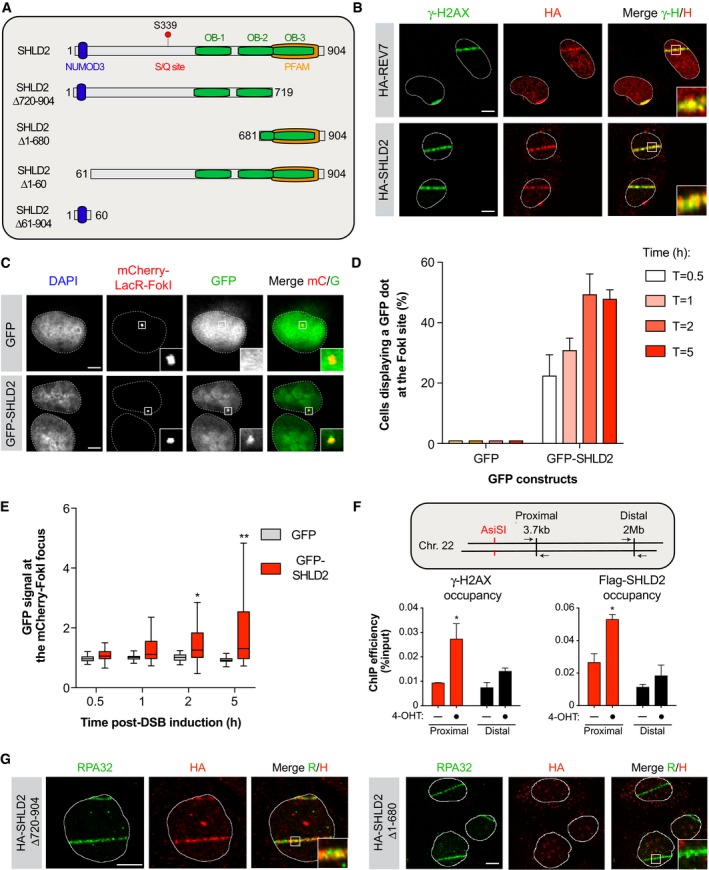
Schematic representation of SHLD2 and the different mutants used in this study. Each putative structural domain of SHLD2 is represented.
U2OS cells stably expressing HA‐REV7 (Top) or HA‐SHLD2 (Bottom) were pre‐sensitized with 10 μg/ml Hoescht 33342 before exposed to UV micro‐irradiation. Immunofluorescence against HA epitope and endogenous γ‐H2AX was subsequently performed to monitor REV7 and SHLD2 accumulation at sites of damage. Shown are representative micrographs. Scale bar = 5 μm.
U2OS LacR‐Fok1 cells were transfected with GFP or GFP‐SHLD2, and 24 h later DNA damage was induced using Shield‐1 and 4‐OHT. The cells were then processed for GFP and mCherry immunofluorescence. Shown are representative micrographs. Scale bar = 5 μm.
Quantification of the experiments shown in (C). Data are represented as the mean ± SD (n = 3). At least 100 cells per condition were counted.
Quantification of the experiments shown in (C). Shown is the quantification of the GFP signal at the mCherry‐LacR‐Fok1 focus. Data are represented as a box‐and‐whisker plot in the style of Tukey. At least 100 cells per condition were counted. Significance was determined by non‐parametric test followed by a Kruskal–Wallis test. *P < 0.005, **P < 0.0005.
Schematic representation of the site‐directed generation of DSB by the restriction enzyme AsiSI (Top). 293T cell lines expressing ER‐AsiSI with Flag‐SHLD2 and treated with 1 μM of 4‐OHT. 6 h later, the cells were processed and immunoprecipitated with Anti‐FLAG Magnetic Beads and anti‐γ‐H2AX.x/Protein A/G magnetic beads. DNA was purified and subjected to qPCR detection. Shown is the quantification of IP efficiency as the percentage of DNA precipitated from input (Bottom). Data are presented as the mean ± SEM (n = 3). Significance was determined by two‐way ANOVA followed by a Sidak test. *P < 0.05.
U2OS cells stably expressing HA‐SHLD2Δ720–904 (Left) or HA‐SHLD2Δ1–680 (Right) were processed as in (B). Immunofluorescence against HA epitope and endogenous RPA32 was subsequently performed to monitor RPA32 and SHLD2 accumulation at sites of damage. Shown are representative micrographs. Scale bar = 5 μm.

