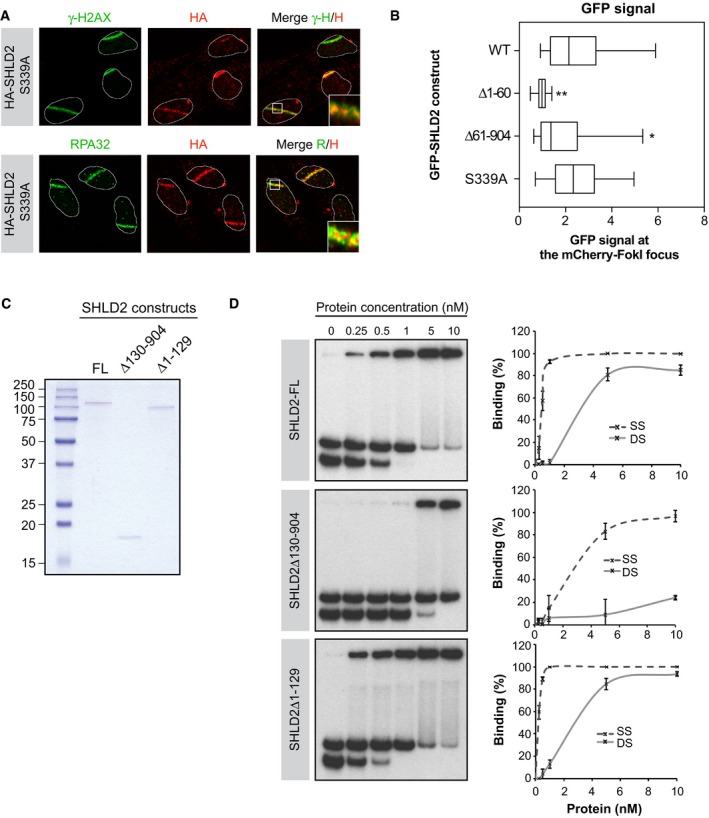
Figure EV3. Structure‐function analysis of SHLD2.

- U2OS cells stably expressing HA‐SHLD2‐S399A were processed as previously described. Immunofluorescence against endogenous HA, γ‐H2AX (Top), and RPA32 (Bottom) epitope was subsequently performed to monitor their accumulation at sites of damage. Shown are representative micrographs.
- U2OS LacR‐Fok1 cells were transfected with GFP‐SHLD2, GFP‐SHLD2‐S339A, GFP‐SHLD2‐∆1‐60, or GFP‐SHLD2‐∆61‐904 mutant, and 24 h later, DNA damage was induced using Shield‐1 and 4‐OHT. The cells were then processed for GFP and mCherry immunofluorescence. Shown is the quantification of cells expressing GFP at Fok1 sites. Data are represented as a box‐and‐whisker plot where the whiskers represent the 10–90 percentile. At least 75 cells were counted per condition. Significance was determined by one‐way ANOVA followed by a Dunnett's test. *P < 0.005, **P < 0.0005
- Recombinant SHLD2 constructs were purified from Sf9 insect infected, and protein purity was assessed by Coomassie Blue stain. Shown are the protein samples used for the DNA‐binding assay.
- In vitro DNA‐binding assay was performed using a purified recombinant SHLD2 or SHLD2‐mutants (concentration range: 0–10 nM) with 32P labeled DNA oligonucleotide substrates. Protein–DNA complexes were subjected to electrophoresis and visualized by autoradiography. Representative binding experiments (left panel; n = 3) and quantification of the binding efficiency (right panel) are shown.
