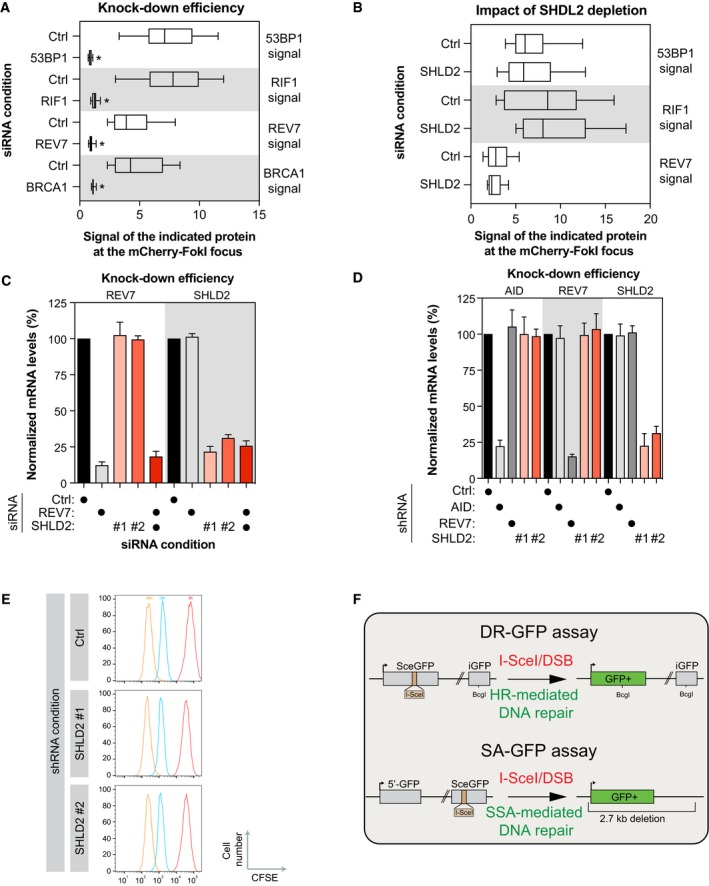
U2OS LacR‐Fok1 cells were transfected with small interfering RNA directed against 53BP1, RIF1, REV7, or BRCA1. Forty‐eight hours later, the cells were then processed for AF647 and mCherry immunofluorescence. Shown is the ratio of fluorescence of AF647 at Fok1 focus compared to background. Data are represented as a box‐and‐whisker plot where the whiskers represent the 10–90 percentile. At least 75 cells were counted per condition. Significance was determined by one‐way ANOVA followed by a Dunnett's test. *P < 0.005
U2OS LacR‐Fok1 cells were transfected with small interfering RNA directed against SHLD2. 48 h later, DNA damage was induced using Shield‐1 and 4‐OHT, followed by staining to identify 53BP1, RIF1, REV7, or BRCA1 protein localization by indirect AF647 fluorescence. The cells were then processed for AF647 and mCherry immunofluorescence. Shown is the quantification of cells expression GFP at Fok1 sites. Data are represented as a box‐and‐whisker plot where the whiskers represent the 10–90 percentile. At least 75 cells were counted per condition. Significance was determined by one‐way ANOVA followed by a Dunnett's test.
EJ5‐2OS cells were transfected with small interfering RNA against REV7 or SHLD2 for 48 h, total RNA was isolated, cDNA was generated, and levels of REV7 and SHLD2 were identified by qPCR. mRNA levels were normalized to mRNA levels of GAPDH. Data are presented as the mean ± SEM (n = 3). Significance was determined by one‐way ANOVA followed by a Dunnett's test.
CH12F2‐3 cells were subjected to lentiviral‐mediated short hairpin RNA knockdown for REV7 or SHLD2, selected with puromycin for 48 h then harvested. Total RNA was isolated, cDNA was generated, and levels of REV7 and SHLD2 were identified by qPCR. mRNA levels were normalized to mRNA levels of GAPDH. Data are presented as the mean ± SEM (n = 3). Significance was determined by one‐way ANOVA followed by a Dunnett's test.
Proliferation of the different transduced CH12F3‐2 cell lines was monitored using CFSE dilution. FACS profiles are representative of three independent experiments.
Schematic diagram of both the DR‐GFP reporter assay (Top) and the SA‐GFP reporter assay showing (Bottom).

