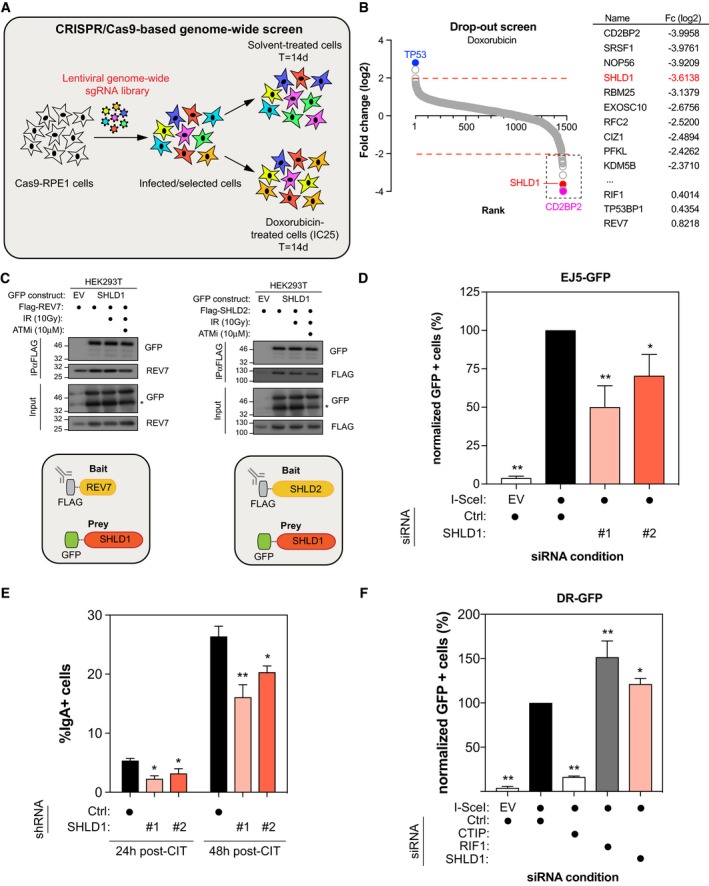
Schematic representation of CRISPR/Cas9‐based genome‐wide screen under doxorubicin treatment.
Genes significantly enriched or dropped out after a 14‐day treatment with doxorubicin were identified by plotting as a Log2 fold change compared to untreated. Ranking was determined based on the Log2 fold score (Left). The top 10 doxorubicin sensitizers are indicated on the right with their respective fold change (Fc) in Log2.
293T cells were transfected with Flag‐REV7 and GFP‐SHLD1 (Left) or Flag‐SHLD2 and GFP‐SHLD1 (Right) expression vectors as indicated. 24 h post‐transfection, cells were treated with DMSO or with 10 μM of ATM inhibitor KU‐60019 for 1 h prior to irradiation. 1 h post‐irradiation (10 Gy), nuclear extracts were prepared and REV7 or SHLD2 complexes were immunoprecipitated using anti‐Flag (M2) resin and then analyzed by immunoblotting using GFP and REV7 antibodies.
U2OS EJ5‐GFP cells were transfected with either siCTRL, siSHLD1 #1, or siSHLD1 #2. At 24 h post‐transfection, cells were transfected with the I‐SceI expression plasmid, and the GFP+ population was analyzed 48‐h post‐plasmid transfection. The percentage of GFP+ cells was determined for each individual condition and subsequently normalized to the non‐targeting condition (siCTRL). Data are presented as the mean ± SD (n = 3). Significance was determined by one‐way ANOVA followed by a Dunnett's test. *P < 0.005, **P < 0.0005.
CH12F3‐2 cells stably expressing either shCTRL, shSHLD1#1, or shSHLD1#2 were stimulated with a cocktail of cytokines (CIT) to induce class switching to IgA. The percentage of IgA+ cells was monitored 24 and 48 h post‐stimulation by staining with an anti‐IgA antibody followed by flow cytometry analysis. Data are presented as the mean ± SD (n = 3). Significance was determined by one‐way ANOVA followed by a Dunnett's test. *P < 0.05, **P < 0.005.
U2OS DR‐GFP cells were transfected with the indicated siRNAs. At 24 h post‐transfection, cells were transfected with the I‐SceI expression plasmid, and the GFP+ population was analyzed 48 h post‐plasmid transfection. The percentage of GFP+ cells was determined for each individual condition and subsequently normalized to the non‐targeting condition (siCTRL). Data are presented as the mean ± SD (n = 3). Significance was determined by one‐way ANOVA followed by a Dunnett's test. *P < 0.005, **P < 0.0005.

