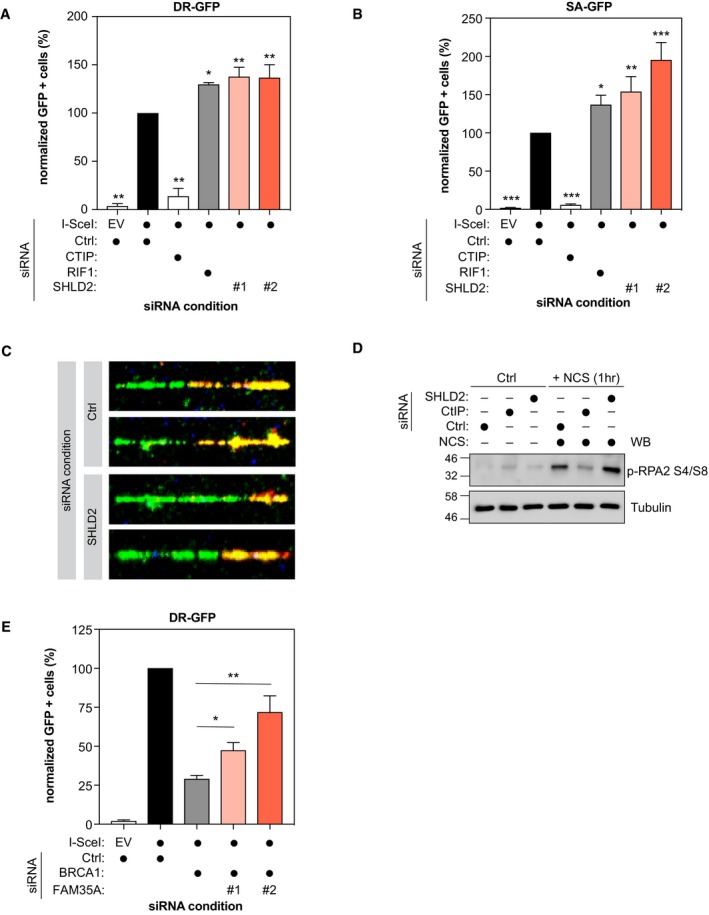
HeLa DR‐GFP cells were transfected with the indicated siRNAs. At 24 h post‐transfection, cells were transfected with the I‐SceI expression plasmid, and the GFP+ population was analyzed 48‐h post‐plasmid transfection. The percentage of GFP+ cells was determined for each individual condition and subsequently normalized to the non‐targeting condition (siCTRL). Data are presented as the mean ± SD (n = 3). Significance was determined by one‐way ANOVA followed by a Dunnett's test. *P < 0.0005, **P = 0.0001.
U2OS SA‐GFP cells were transfected with the indicated siRNAs. At 24 h post‐transfection, cells were transfected with the I‐SceI expression plasmid, and the GFP+ population was analyzed 48‐h post‐plasmid transfection. The percentage of GFP+ cells was determined for each individual condition and subsequently normalized to the non‐targeting condition (siCTRL). Data are presented as the mean ± SD (n = 3). Significance was determined by one‐way ANOVA followed by a Dunnett's test. *P < 0.05, **P < 0.005, ***P < 0.0005.
Representative images of the DNA fiber assay obtained from U2OS cells which were transfected with the indicated siRNAs and then treated with CldU, IdU, and NCS 48 h post‐transfection as indicated. The slides were stained, dehydrated, mounted, and visualized and shown is the quantification of CldU/IdU tract length in order to visualize DNA end resection.
U2OS cells were transfected with the indicated siRNAs. The DNA damage experimental condition was performed using 500 ng/ml of neocarzinostatin (NCS) for 1 h. Cells were washed in D‐PBS and harvested with a lysis buffer [50 mM HEPES, KOH (pH 8.0), 100 mM KCl, 2 mM EDTA, 0.1% NP‐40, 10% glycerol] supplemented with protease/phosphatase inhibitors. The resulting whole cell lysates were analyzed by immunoblotting using p‐RPA and α‐tubulin, then analyzed by immunoblotting using GFP, REV7, and p‐Chk1 antibodies.
HeLa DR‐GFP cells were co‐transfected with siBRCA1 and the indicated siRNAs. At 24 h post‐transfection, cells were transfected with the I‐SceI expression plasmid, and the GFP+ population was analyzed 48‐h post‐plasmid transfection. The percentage of GFP+ cells was determined for each individual condition and subsequently normalized to the non‐targeting condition (siCTRL). Data are presented as the mean ± SD (n = 3). Significance was determined by one‐way ANOVA followed by a Dunnett's test. *P < 0.05, **P < 0.0005.