
Figure EV6. Identification of SHLD2 interactome.
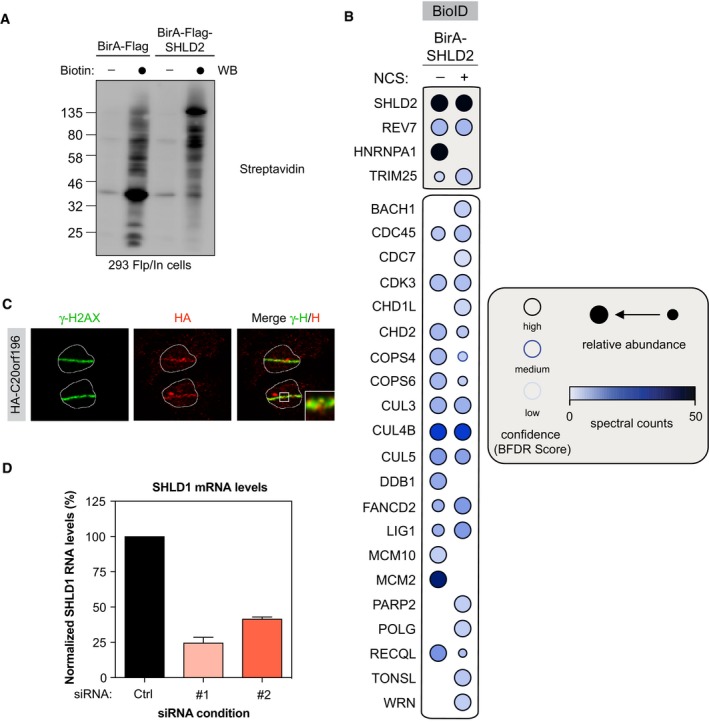
- HEK293‐TREx cells transfected with a BirA‐Flag or BirA‐Flag‐SHLD2 construct were tested for biotinylation following incubation with biotin as indicated. After lysis, samples were immunoblotted for streptavidin.
- Selected BioID SHLD2 results, shown as dot plots. The spectral counts for each indicated prey protein are shown as AvgSpec. Proteins were selected based on and iProphet probability of > 0.95, BFDR of < 0.05 and ≥ 10 peptide count. The circle size represents the relative abundance of preys over baits.
- U2OS cells stably expressing HA‐SHLD1 were processed as previously described. Immunofluorescence against endogenous HA and γ‐H2AX epitope was subsequently performed to monitor their accumulation at sites of damage. Shown are representative micrographs.
- EJ5‐2OS cells were transfected with small interfering RNA against SHLD1 for 48 h, total RNA was isolated, cDNA was generated, and levels of SHLD1 were identified by qPCR. mRNA levels were normalized to mRNA levels of GAPDH.