-
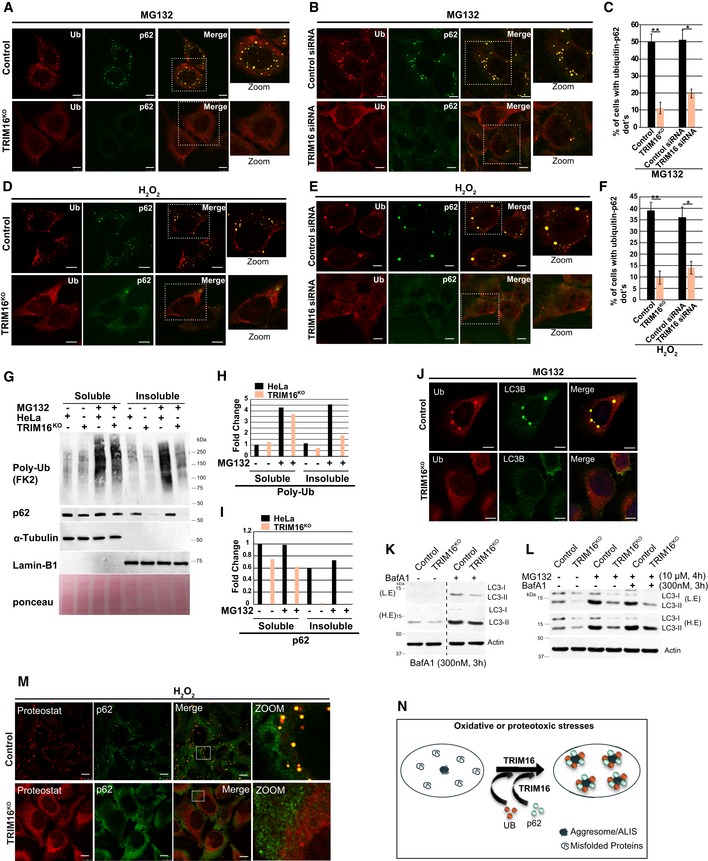
A–F
(A, D) Representative confocal images of HeLa and TRIM16KO cells treated with (A) MG132 (20 μM, 2 h, scale bar: 7.5 μm) or (D) H2O2 (200 μM, 2 h) and the samples were processed for IF analysis with Ub and p62 antibody. (B, E) Representative confocal images of control siRNA and TRIM16 siRNA transfected cells treated with (B) MG132 (20 μM, 2 h), (E) H2O2, (200 μM, 2 h), where IF analysis was conducted with Ub and p62 antibodies. (C, F) The graph shows the percentage of cells with Ub‐p62 co‐localized dots. Data from ≥ 10 fields (40×), n = 3, mean ± SD, **P < 0.0003, *P < 0.002 (Student's unpaired t‐test).
-
G
Western blot (WB) analysis of detergent‐soluble and detergent‐insoluble fractions of HeLa and TRIM16KO cells treated with MG132 (50 μM, 1 h) and probed with indicated antibodies.
-
H, I
Densitometric analysis (using ImageJ) of WB normalized with α‐tubulin or lamin‐B1.
-
J
Representative confocal images of HeLa and TRIM16KO cells treated with MG132 (20 μM, 2 h) and processed for IF analysis with Ub and LC3B antibody.
-
K, L
WB analysis of LC3B levels in lysates of HeLa and TRIM16KO cells treated with (K) bafilomycin A1 (300 nM, 3 h) alone or (L) with MG132 (10 μM, 4 h) as indicated. L.E, low exposure; H.E, high exposure.
-
M
Representative confocal images HeLa and TRIM16KO cells treated with H2O2 (200 μM, 2 h) and processed for IF analysis with ProteoStat dye, and p62 antibody. To show the cellular details, the brightness of TRIM16KO cells images was increased more than control cells.
-
N
Pictorial representation of data presented in Figs
1 and
EV1.
Data information: Unless otherwise stated, scale bar: 10 μm.

