-
A
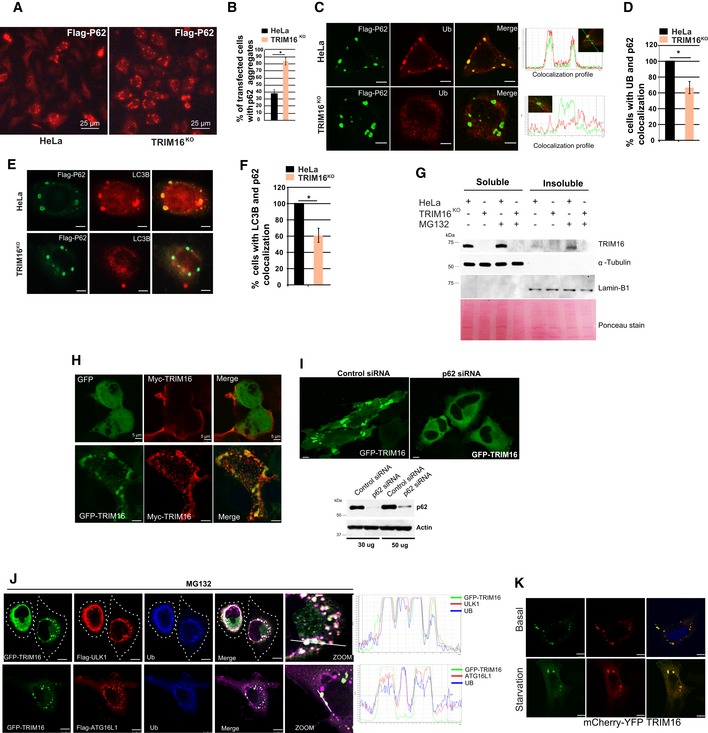
Representative confocal images of HeLa and TRIM16KO cells transiently expressing Flag‐p62.
-
B
The graph shows the percentage of transfected cells with p62‐aggregates. Data from ≥ 10 microscopic fields for each condition (40×), n = 3, mean ± SD, *P < 0.05 (Student's unpaired t‐test).
-
C–F
(C, E) Representative confocal images of HeLa and TRIM16KO cells expressing Flag‐p62 and IF analysis was performed with Flag and (C) Ub or (E) LC3B antibodies. (D, F) The graph shows the percentage of cells with p62‐Ub (D) or p62‐LC3B (F) co‐localized aggregates. Data from ≥ 10 microscopic fields, n = 3, mean ± SD, *P < 0.05 (Student's unpaired t‐test).
-
G
WB analysis of detergent‐soluble and detergent‐insoluble fractions of HeLa and TRIM16KO cells, untreated or treated with MG132 (10 μM, 4 h), and probed with indicated antibodies.
-
H
Representative confocal images of HEK293T cells transiently expressing GFP‐TRIM16 and Myc‐TRIM16.
-
I
Upper panel, representative confocal images of control or p62 siRNA transfected HeLa cells transiently expressing GFP‐TRIM16. Lower panel, WB showing the knockdown efficiency of p62 siRNA.
-
J
Representative confocal images of HeLa cells expressing GFP‐TRIM16, Flag‐ULK1, or Flag‐ATG16L1 treated with MG132 (10 μM, 4 h) and/or bafilomycin A1 (300 nM, 3 h) and IF analysis is performed with antibodies as indicated. Right: Fluorescence intensity line is tracing corresponding to the white line.
-
K
Representative confocal images of starved and unstarved HEK293T cells transiently expressing mcherry‐YFP‐TRIM16.
Data information: Unless otherwise stated, scale bar: 10 μm.

