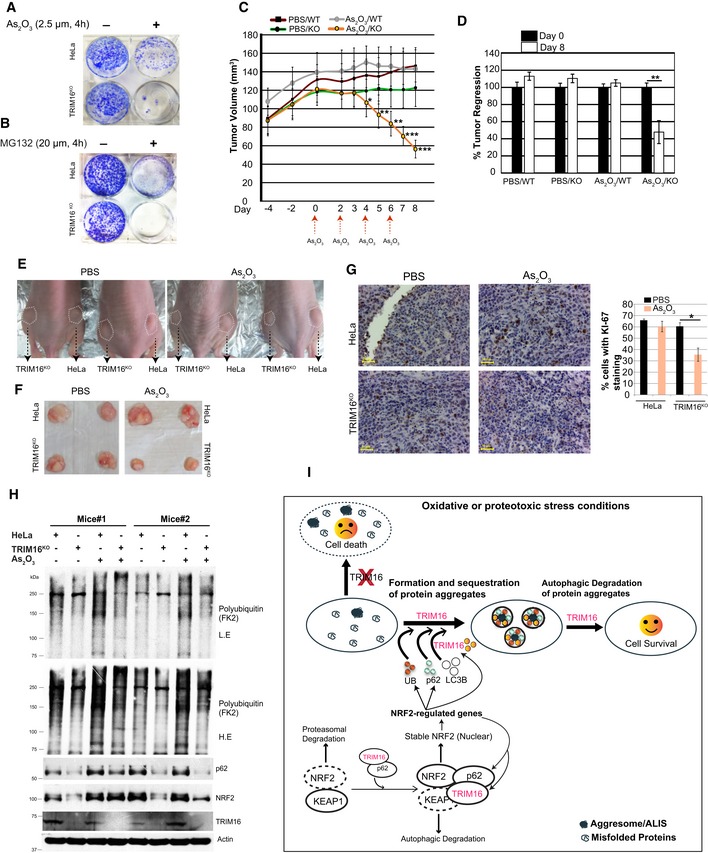
Figure 9. TRIM16 is protective against oxidative stress‐induced cytotoxicity in vivo .

-
A, BClonogenic assays were performed with HeLa and TRIM16KO cells, untreated or treated with As2O3 or MG132.
-
CTumor volumes of HeLa and TRIM16KO tumors at indicated time points. As2O3 is injected when tumor volume of all groups was > 100 mm3 (day 0 in the graph). Tumor volumes were measured on an interval as indicated. Mean ± SE, n = 6 (each group), *P < 0.05, **P < 0.005, ***P < 0.0005 (ANOVA).
-
DGraph shows the % tumor regression (tumor volume on day 1 of As2O3 treatment/tumor volume on day of sacrifice × 100). Mean ± SE, n = 6 (each group), **P < 0.005 (Student's unpaired t‐test).
-
ERepresentative images of HeLa and TRIM16KO tumors formed in the nude mice in the absence and presence of As2O3.
-
FRepresentative pictures of dissected tumors.
-
GImmunohistochemistry analysis performed with KI‐67 cell proliferation marker and hematoxylin nuclear stain. The graph represents the % of cells with KI‐67 staining. > 400 cells were counted for this analysis from three different sections from different animals, mean ± SD, *P < 0.05 (Student's unpaired t‐test). Scale bar: 50 μm.
-
HWB analysis of tumor tissue lysates from two different mice with antibodies as indicated. L.E, low exposure; H.E, high exposure.
-
IGraphical representation of work presented in this study.
Source data are available online for this figure.
