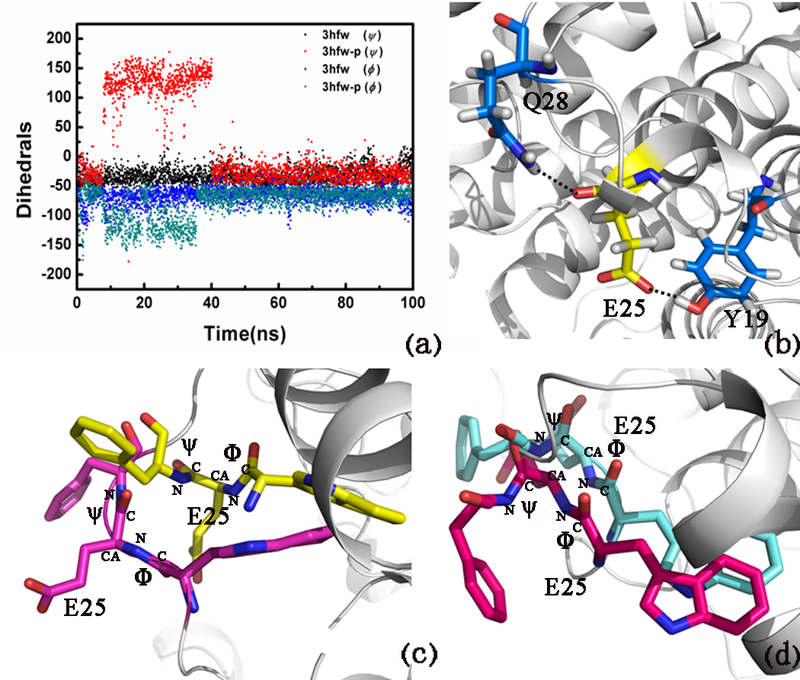
Figure 4.

Modeling of ARH1. (a) Variation of the main-chain torsion of Glu25 with respect to simulation time during 100 ns, (b) H-bonds among Glu25, Gln28, and Tyr19 (only disappeared in the non-phosphorylated ARH1 in 30 ns), (c) Glu25 in the non-phosphorylated ARH1 (30 ns, shown in blue) and in the ARH1-P type (30 ns, shown in green), and (d) Glu25 in the non-phosphorylated ARH1 (60 ns, shown in yellow) and in the ARH1-P type (60 ns, shown in pink).
