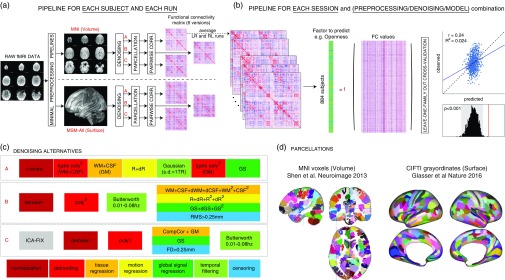
Figure 1.
Overview of our approach. In total, we separately analyzed 36 different sets of results: two data sessions × two alignment/brain parcellation schemes × three preprocessing pipelines × three predictive models (univariate positive, univariate negative, and multivariate). (a) The data from each selected Human Connectome Project subject (N subjects=884) and each run (REST1_LR, REST1_RL, REST2_LR, REST2_RL) was downloaded after minimal preprocessing, both in MNI space, and in multimodal surface matching (MSM)-All space. The _LR and _RL runs within each session were averaged, producing two data sets that we call REST1 and REST2 henceforth. Data for REST1 and REST2, and for both spaces (MNI, MSM-All) were analyzed separately. We applied three alternate denoising pipelines to remove typical confounds found in resting-state functional magnetic resonance imaging (fMRI) data (see c). We then parcellated the data (see d) and built a functional connectivity matrix separately for each alternative. This yielded six functional connectivity (FC) matrices per run and per subject. In red: alternatives taken and presented in this paper. (b) For each of the six alternatives, an average FC matrix was computed for REST1 (from REST1_LR and REST1_RL), for REST2 (from REST2_LR and REST2_RL), and for all runs together, REST12. For a given session, we built a (N subjects×N edges) matrix, stacking the upper triangular part of all subjects’ FC matrices (the lower triangular part is discarded, because FC matrices are diagonally symmetric). Each column thus corresponds to a single entry in the upper triangle of the FC matrix (a pairwise correlation between two brain parcels, or edge) across all 884 subjects. There are a total of N parcels(N parcels−1)/2 edges (thus: 35,778 edges for the 268-node parcellation used in MNI space, 64,620 edges for the 360-node parcellation used in MSM-All space). This was the data from which we then predicted individual differences in each of the personality factors. We used two different linear models (see text), and a leave-one-family-out cross-validation scheme. The final result is a predicted score for each subject, against which we correlate the observed score for statistical assessment of the prediction. Permutations are used to assess statistical significance. (c) Detail of the three denoising alternatives. These are common denoising strategies for resting-state fMRI. The steps are color-coded to indicate the category of operation they correspond to (legend at the bottom) (see text for details). (d) The parcellations used for the MNI-space and MSM-All space, respectively. Parcels are randomly colored for visualization. Note that the parcellation used for MSM-All space does not include subcortical structures, while the parcellation used for MNI space does. WM=white matter; CSF=cerebrospinal fluid; GM=gray matter; dr=derivative of realignment parameters; GS=global signal; dWM=derivative of white matter signal; dCSF=derivative of CSF signal; dGS=derivative of global signal; CIFTI=Connectivity Informatics Technology Initiative; NEOFAC=revised NEO personality inventory factor.

