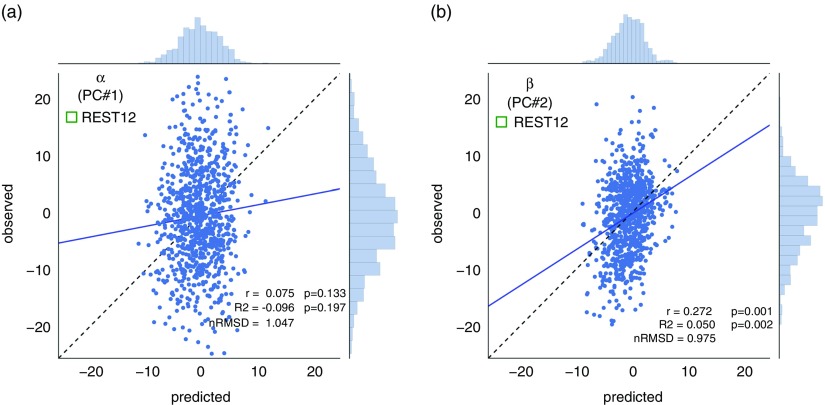
Figure 6.
Prediction results for superordinate factors/principal components α and β, using REST12 data (1 hr of resting-state functional magnetic resonance imaging per subject). These results use MSM-All intersubject alignment, denoising strategy A, and the multivariate prediction model. As in Figure 5b, the range of predicted scores is much narrower than the range of observed scores. (a) The first principal component (PC), α, is not predicted better than chance. α loads mostly on Neuroticism (see Figure 2c), which was itself not predicted well (cf. Figure 5). (b) We can predict about 5% of the variance in the score on the second PC, β. This is better than chance, as established by permutation statistics (p 1000<.002). β loads mostly on Openness to experience (see Figure 2c), which showed good predictability in the previous section. RMSD=root mean square deviation.

