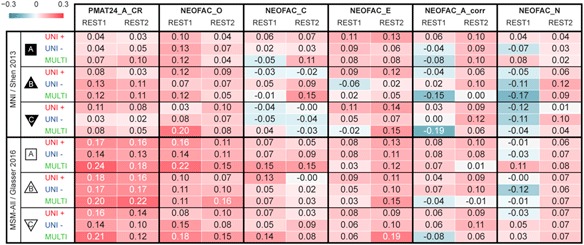
Table 1.
Test-retest prediction results using deconfounded scores

|
Note. Listed are Pearson correlation coefficients between predicted and observed individual scores, for all behavioral scores and analytical alternatives (the two columns for each score correspond to the two resting-state sessions). See Supplementary Figure 1 for results with minimal deconfounding.
MSM=multimodal surface matching.
