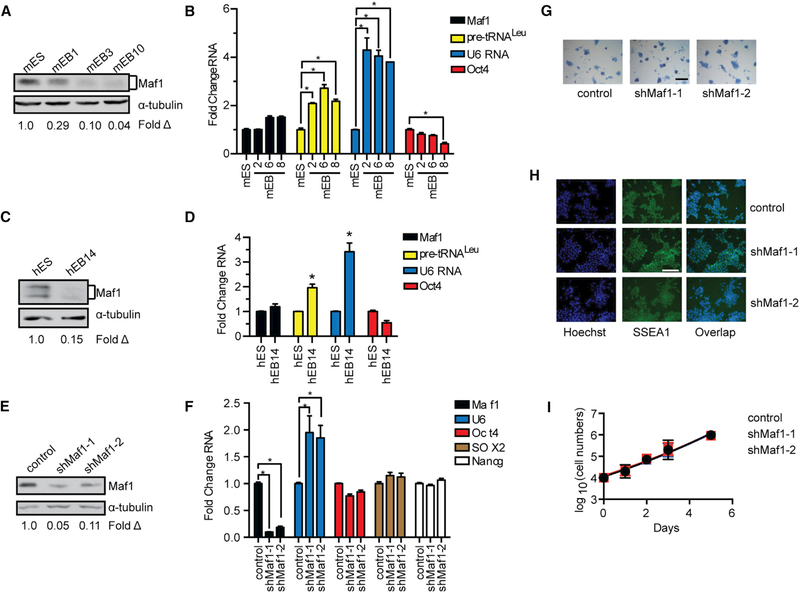
Figure 1. Maf1 Does Not Affect mESC Self-Renewal.
(A) Maf1 protein expression in mESCs and mEBs. mEB1, mEB3, and mEB10 represent the number of days after mEB formation. Protein amounts for the immunoblots were normalized to α-tubulin; fold change was calculated relative to Maf1 protein amounts in mESCs.
(B) RT-PCR of Maf1 and Oct4 mRNA and Maf1 target genes, tRNALeu and U6 RNA, in mESCs and mEBs at the indicated days. The amount of transcript was normalized to β-actin. The fold change was calculated relative to the amount of transcripts expressed in mESCs.
(C) Maf1 expression in hESCs and hEBs at day 14 (hEB14). Protein amounts for the immunoblots were normalized to α-tubulin, and the fold change was calculated relative to the amount of protein in hESCs.
(D) qRT-PCR analysis of Maf1 and Oct4 mRNA, tRNALeu, and U6 RNA at day 14. The amount of transcript was normalized to β-actin. The fold change was calculated relative to the amount of each transcript in hESCs.
(E) Immunoblot analysis for Maf1 expression that was decreased in mESCs. Immunoblot analysis of Maf1 protein in control and Maf1 knockdown mESCs normalized to α-tubulin. The fold change in Maf1 expression was calculated relative to protein in control mESCs.
(F) qRT-PCR analysis of Maf1, U6 RNA, and self-renewal markers, Oct4, SOX2, and Nanog mRNAs in mESCs. The amount of transcript was normalized tob-actin. The fold change was calculated relative to lentivirus-infected control cells.
(G) Alkaline phosphatase staining of control and Maf1-knockdown mESCs. Scale bar denotes 200 μm.
(H) Immunostaining images of control and Maf1-knockdown mESCs antibody against SSEA1. Scale bar denotes 100 μm.
(I) Cell accumulation rates of control and Maf1-knockdown mESCs. Control and Maf1-knockdown mESCs were plated evenly on day 0, and the cell numbers were counted at the indicated days.
For (B), (D), (F), and (I), data are mean ± SD of n = 3 independent experiments. *p < 0.05, unpaired Student’s t test.

