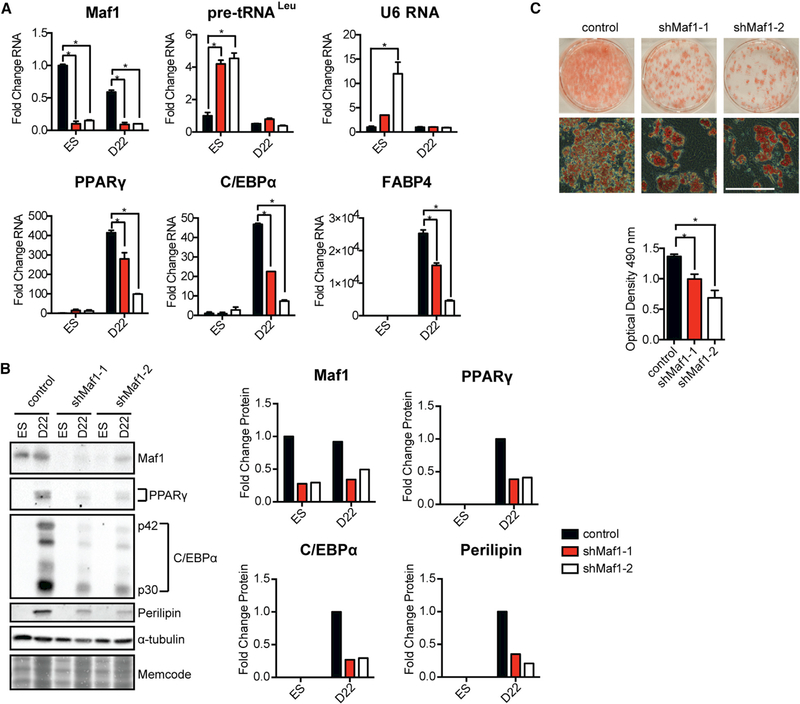
Figure 3. Maf1 Knockdown Compromises Adipogenesis in mESCs.
Control and Maf1-knockdown mESCs were terminally differentiated into adipocytes following a standard protocol (Figure S1A).
(A) qRT-PCR analysis depicting expression of tRNALeu, U6 RNA, and mRNA for Maf1, PPARγ, C/EBPα, and their target, FABP4, pre- and post-differentiation of mouse mESCs into adipocytes at day 22 (D22). Transcript amounts were normalized to β-actin, and the fold change was calculated relative to the amount of transcript in control mESCs. Cells were infected with lentivirus harboring Maf1 shRNA-1, Maf1 shRNA-2, or a lentivirus that lacks the Maf1 shRNA. Data are mean ± SD of n = 3 independent experiments. *p < 0.05, unpaired Student’s t test.
(B) Immunoblot analysis for Maf1, PPARγ, C/EBPα, and perilipin in ESCs and at D22 after differentiation (left) and quantification of changes in protein (right). Fold change in Maf1 expression with Maf1 shRNAs was calculated relative to the expression in ESCs, whereas fold change in PPARγ, C/EBPα, and perilipin with Maf1 knockdown was calculated relative to that at D22.
(C) Representative example of oil red O staining of adipocytes differentiated from control and Maf1-knockdown mESCs (left). Scale bar denotes 200 μm. Quantification of staining (right) represents mean ± SD of n = 3 independent experiments. *p < 0.05, unpaired Student’s t test.

