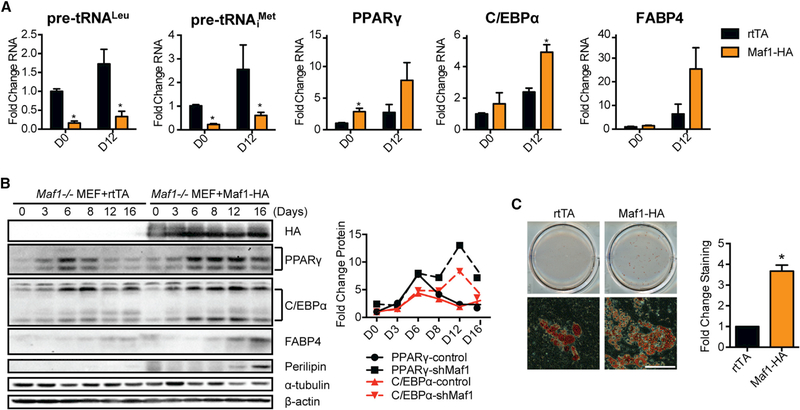
Figure 5. Ectopic Expression of Maf1 Induces Adipogenesis in Maf1−/− MEFs.
Maf1−/− MEFs were infected with dox-inducible rtTA construct as control (rtTA) or co-infected with both rtTA and Maf1-HA dox-inducible constructs. Control and Maf1-HA expressed Maf1−/− MEFs were terminally differentiated into adipocytes using a standard protocol (Figure S1C).
(A) qRT-PCR analysis of RNA expression of tRNALeu, tRNAiMet, PPARγ, C/EBPα, and FABP4 during the differentiation of either control or Maf1-HA cells that were all treated with 50 ng/mL dox from day 0 (D0) to day 12 (D12). Transcript amounts were normalized to β-actin, and the fold change was calculated relative to the amount of transcript at D0 rtTA Maf1−/− MEF cells. Data are mean ± SD of n = 3 independent experiments. *p < 0.05, unpaired Student’s t test.
(B) Immunoblot analysis of HA-tagged Maf1, PPARγ, C/EBPα, FABP4, perilipin, and β-actin in control and Maf1 expressed Maf1−/− MEF cells. Quantification of the changes in protein expression from the immunoblots is shown (right). Protein amounts were normalized to α-tubulin, and the fold change was calculated relative to the amount of protein in D0 rtTA control Maf1−/− MEF cells.
(C) Oil red O staining of adipocytes that are differentiated from control and Maf1-HA expressed Maf1−/− MEFs (left). Scale bar denotes 200 μm. Quantification of staining (right); data are mean ± SD of n = 3 independent experiments. *p < 0.05, unpaired Student’s t test.

