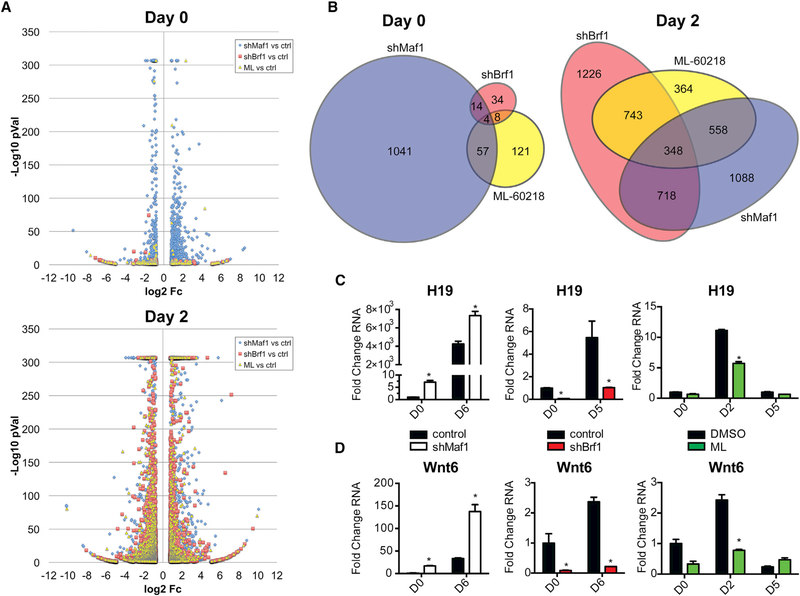
Figure 7. Gene Expression Analysis Shows Distinctiveness in the Maf1 Transcriptome Pre-differentiation and an Enriched Gene Signature for Adipogenic Genes during Differentiation.
Differentially regulated transcripts in 3T3-L1 cells that were produced by knockdowns of Maf1, Brf1 (shMaf1 and shBrf1, respectively), or treatment of the cells with the RNA pol III-specific chemical inhibitor ML-60218 (ML).
(A and B) Before addition of differentiation cocktail (day 0) and 2 days after differentiation induction (day 2). (A) Volcano plot illustration of differentially expressed genes selected on the stringency basis of Student’s t test p value % ≤0.01 and ≥1.7-fold change in expression compared with control cells; they are represented by their fold change in log2 scale depicted on the × axis and by their statistical significance on the basis of –log10 p value shown on the y axis (transcripts with greater statistical significance are higher in the plot). To limit the height of the illustration, –log10 p values were capped at 307. (B) Area-proportional Euler Venn diagrams of RNA-seq transcripts shown in the volcano plot data where there are 1,108, 52, and 182 differentially regulated genes for shMaf1, shBrf1, and ML-60218, respectively, plotted for day 0 and 2,016, 2,339, and 1,317 genes for day 2.
(C and D) qRT-PCR analysis of expression of lncRNA H19 (C) and Wnt6 (D) in control and Maf1-knockdown, control and Brf1-knockdown, and DMSO control and ML-60218-treated 3T3-L1 cells at the indicated days. Transcript amounts were normalized to β-actin, and the fold change was calculated relative to the amount of transcript at D0 for control cells. *p < 0.05, unpaired Student’s t test.

