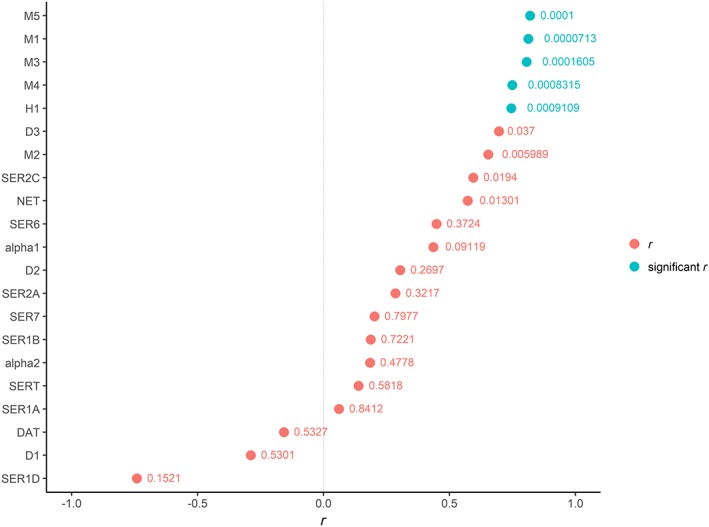
Figure 4.

Pearson's correlation coefficients (r) and their P‐values of the relationship between aROR for diabetes and the occupancy on each receptor/transporter. The receptors 5‐HT3 and D4 were not analysed due to lack of pharmacodynamic data. P‐values were adjusted to Bonferroni correction due to multiple correlations (21) to 0.00238. Significant correlations were observed for occupancies on the muscarinic receptors, except for M2, and the histamine H1 receptor. Degrees of occupancy less than 0.1% were excluded, as well as antidepressants with less than three reports with diabetes
