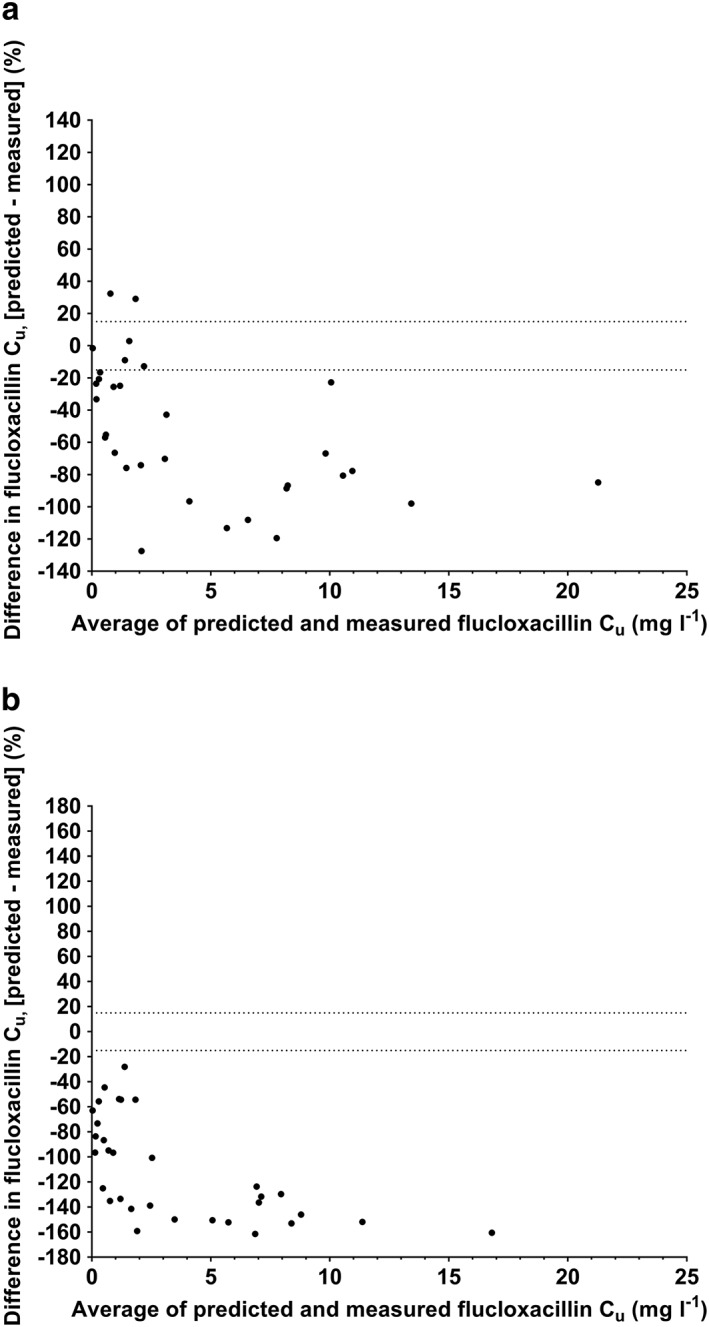
Figure 2.

Bland–Altman plots of predicted unbound flucloxacillin concentrations using single binding site prediction model (A) and fixed fu of 0.04 (B) compared with measured unbound flucloxacillin concentrations in hospitalized patients. Cu, unbound concentration. Dotted horizontal lines represent +15% and –15% difference
