
Figure 5.
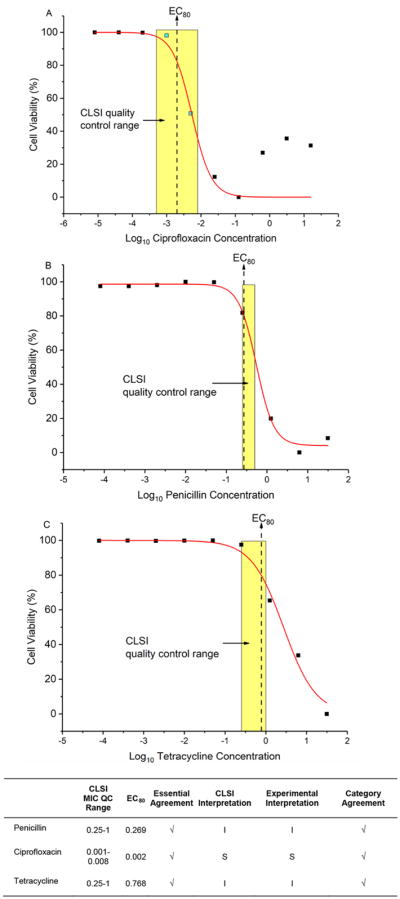
Dose–response modeling of ATCC 49226 phenotypic responses under the treatment of ciprofloxacin, penicillin, and tetracycline via direct-qPCR. A sigmoidal dose–response curve was fitted to the 2−ΔCq values using the function (1), where f(x) is normalized 2−ΔCq(in the range of 0–100%), x is the base-10 logarithm of antimicrobial concentration in μg/mL, A1 is the upper asymptote, A2 is the lower asymptote, log(x0) is the center of the curve, and p is the hill slope, respectively. The EC80 is the antimicrobial concentration at which the inhibitory effect is 80%. Dose ranges indicated by yellow shades are quality control MIC ranges reported by CLSI. Our predicted AST results (EC80) are in full concordance with the CLSI quality control references.