
Figure 2.
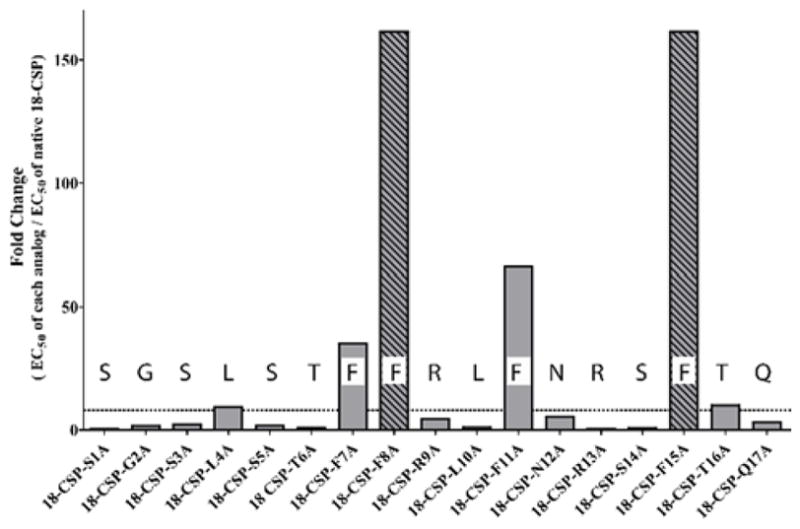
Plot of the ratio of 18-CSP alanine analogs EC50 values divided by the EC50 value of 18-CSP in the SAB249 strain. The plot reveals a periodic sharp reduction in activity every 3–4 residues along the peptide sequence, consistent with an α-helix conformation. Striped bars represent analogs with EC50 values >1,000 nM, thus the EC50 ratio is >160. >8-fold decrease in potency was considered significant (dashed line).