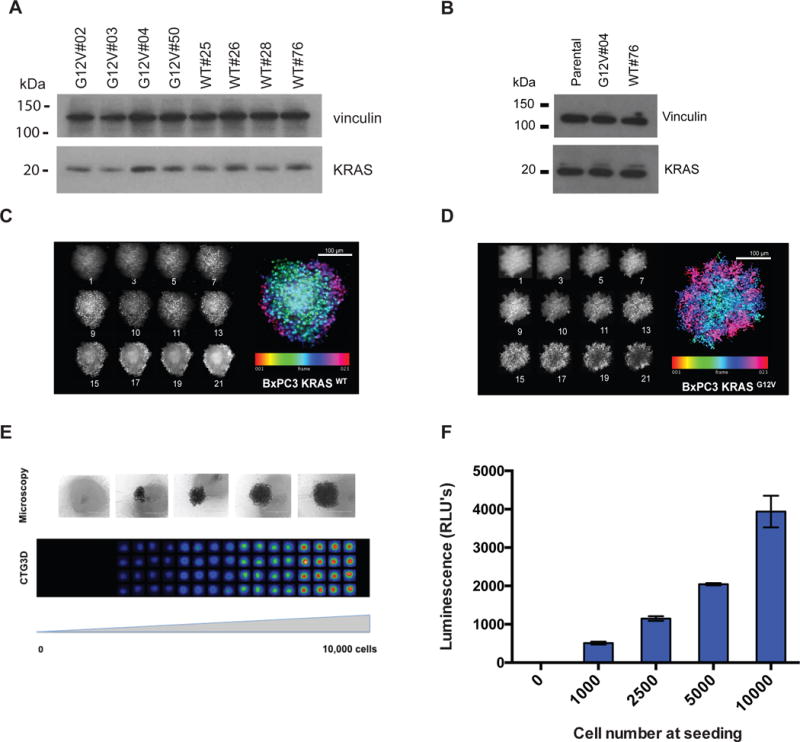
Figure 1. Characterization of the BxPC-3 isogenic cell pair.

(A) Analysis of KRAS expression levels in BxPC-3-KRASG12V and BxPC-3-KRASWT stable cell lines. Individual clones were isolated and evaluated for the expression of KRAS by western blotting analysis using anti-KRAS or anti-Vinculin (loading control) antibodies. (B) Analysis of KRAS expression levels in selected BxPC-3-KRASG12V and BxPC-3-KRASWT stable cell lines and BxPC-3-parental cell line. Confirmation of spheroidicity of (C) BxPC-3-KRASWT or (D) BxPC-3-KRASG12V cells by confocal imaging. Z-stack images were taken at 10 μm increments from the equator of Hoechst-stained spheroids of BxPC-3-KRASG12V and BxPC-3-KRASWT on a GE IN Cell 6000 Analyzer (10× objective, f=1.18AU). Maximum intensity projection along the z-axis of the 12 individual planes aligned in Image J to generate an intensity projection biased by color scale are shown in the left panel. (E–F) Determination of cell viability assay conditions using CellTiter-Glo 3D (CTG3D). BxPC-3 cells were seeded at increasing numbers in a 384-well spheroid plate, grown for 24 hours and treated with CTG3D to assess viability. Relative luminescence of cells was determined at 48 hours post-seeding, using a ViewLux microplate imager (PerkinElmer). Error Bars = S.D. The data shown represent the mean of 3 independent replicates with triplicate data points.
