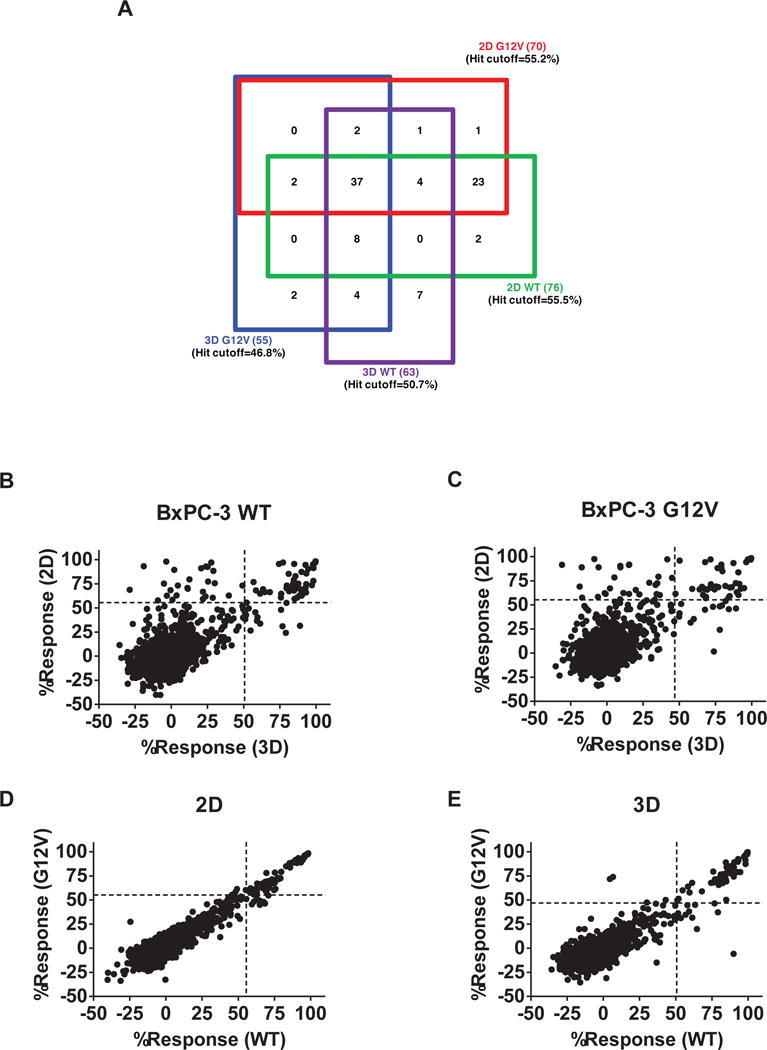
Figure 3. Comparison of performance of compounds in BxPC-3-KRASG12V and BxPC-3-KRASWT cells in 3D and 2D formats.

Primary screening results of Spectrum library against BxPC-3-KRASWT and BxPC-3-KRASG12V in 3D and 2D formats. (A) Four-way Venn diagram of active compounds identified from the four screens. A hit was identified as any compound with % inhibition > the corresponding screen hit cutoff. The numbers in parentheses are the numbers of hits specific for that cell line. The numbers in the boxes represent the number of compounds found to active in those overlapping assays. (B–E) Correlation plots of the % inhibition values of compounds in each of the screens: (B) BxPC-3-KRASWT, 2D vs. 3D. (C) BxPC-3-KRASG12V, 2D vs. 3D. (D) BxPC-3-KRASG12V vs. BxPC-3-KRASWT, 2D. (E) BxPC-3-KRASG12V vs. BxPC-3-KRASWT, 3D.
