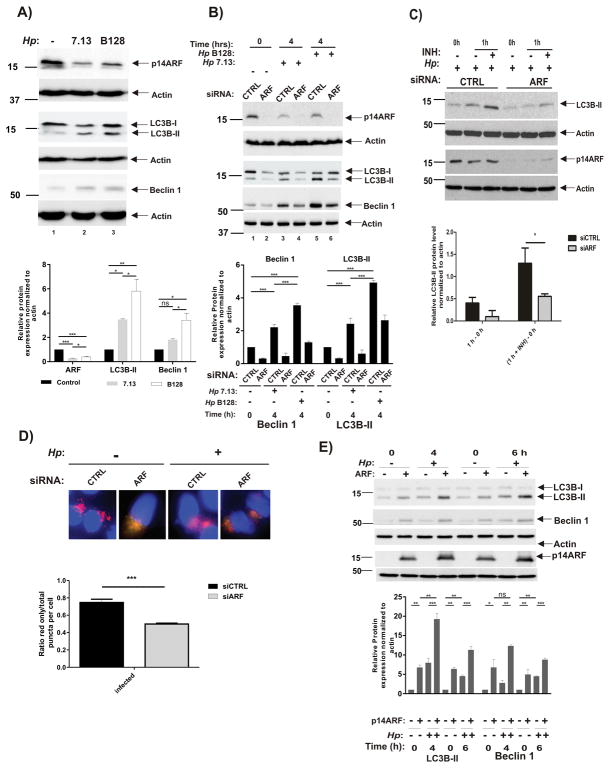
Figure 3. Downregulation of p14ARF in H. pylori-infected cells leads to inhibition of autophagy.
(A) SNU1 cells were co-cultured with 7.13 or B128 strain for 6 hours or left uninfected (−), and p14ARF, LC3B and Beclin 1 proteins were analyzed by Western blot analyses. Protein were quantitated by densitometry. Data are shown as mean ± SEM (n=3). (B) Expression of p14ARF, LC3B and Beclin 1 proteins were analyzed in SNU1 cells, in which ARF was downregulated with specific siRNA (ARF) or scrambled control siRNA (CTRL) for 48 hours. Cells were then co-cultured with strains 7.13 or B128 for the indicated time (+) or left uninfected (−). Protein were quantitated by densitometry. Data are shown as mean ± SEM (n=3). (C) Autophagic flux was inhibited in SNU1 cells in which ARF was downregulated with specific siRNA (ARF) or scrambled control siRNA (CTRL) for 48 hours. Cells were co-cultured with strain 7.13 for 2 hours and treated with pepstatin A and E-64d (INH; both at a final concentration 10 μM) for additional 1 h. Upper panel: A representative Western blot analysis showing expression of LC3B and p14ARF. Bottom panel: Densitometric analyses of autophagic flux. It was calculated by subtraction of the levels of LC3B-II protein (normalized to actin) before treatment (0 h) from ones after treatment with inhibitors (1 h) (*, p<.05). (D) Upper panel: Representative images showing merged red and green puncta in SNU1 cells transfected with mCherry-GFP-LC3B and co-cultured with strain 7.13 for 4 hours. ARF was downregulated with the specific siRNA. Bottom panel: Graphs show red-only puncta relative to total puncta per cell. Results are shown as mean ± SEM from quantification of at least 20 cells per sample (***, p<0.001). (E) Representative Western blots show expression of LC3B, Beclin 1 and p14ARF proteins in AGS cells transfected with p14ARF plasmid (+) or empty vector (−) and then co-cultured with strain 7.13 (+) or left uninfected (−) for the indicated time. Proteins were quantitated by densitometry. Data are shown as mean ± SEM (n=3).

