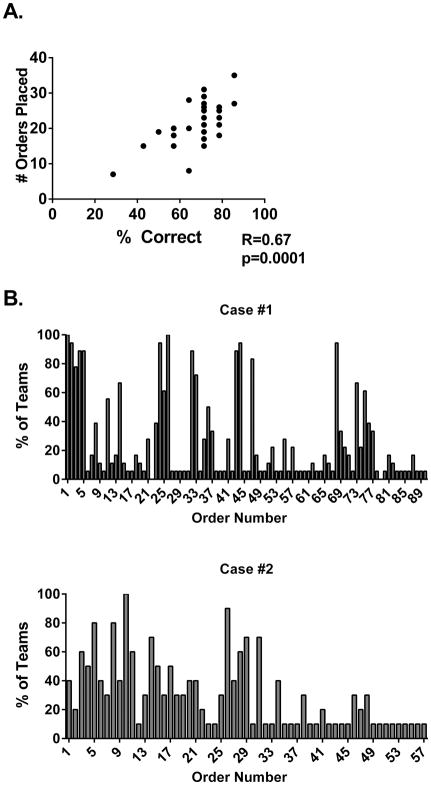
Figure 4. Analysis of requested orders.
28 teams (18 Case #1, 10 Case #2) underwent rounding simulations and orders placed into the EHR analyzed. Panel A- correlation between the number of placed orders and overall team performance as assessed by recognition of safety items. Panel B- Distribution of unique orders for each case. Each column represents a unique orders entered into the EHR in Case 1 (N=90-Top Panel) and Case 2 (N=57-Bottom Panel) with the percent of teams that entered that particular order is delineated on the y-axis.

