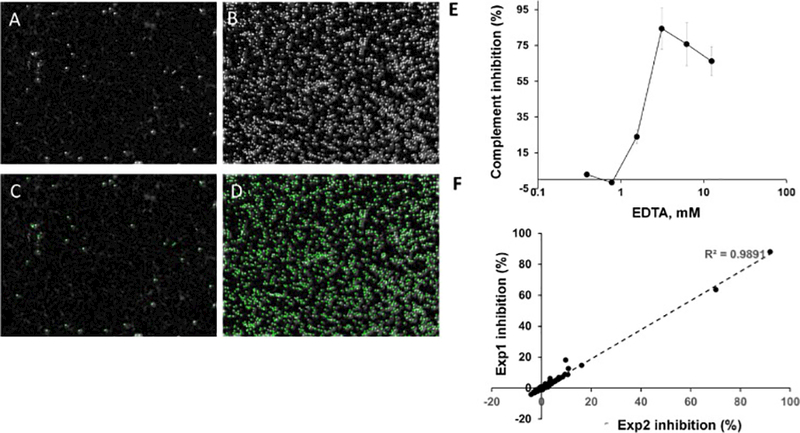
Figure 1.

Evaluation of complement activity using automated cell imaging and image analysis.
A-D, Representative images of wells with EshA in the presence of absence of complement. EshA were incubated in wells of a 384 well plate the presence (A) or absence (B) of complement, then the numbers of intact red blood cells were analyzed by the Operetta image system. A, B, Digital phase-contrast images. C, D, Automated image analysis. Intact EshA are outlined in green. E, Complement inhibitory effect of EDTA as determined by imaging and image analysis. F, Correlation between the inhibition values obtained from two independent experiments with a set of 353 small molecules. EXP, experiment.
