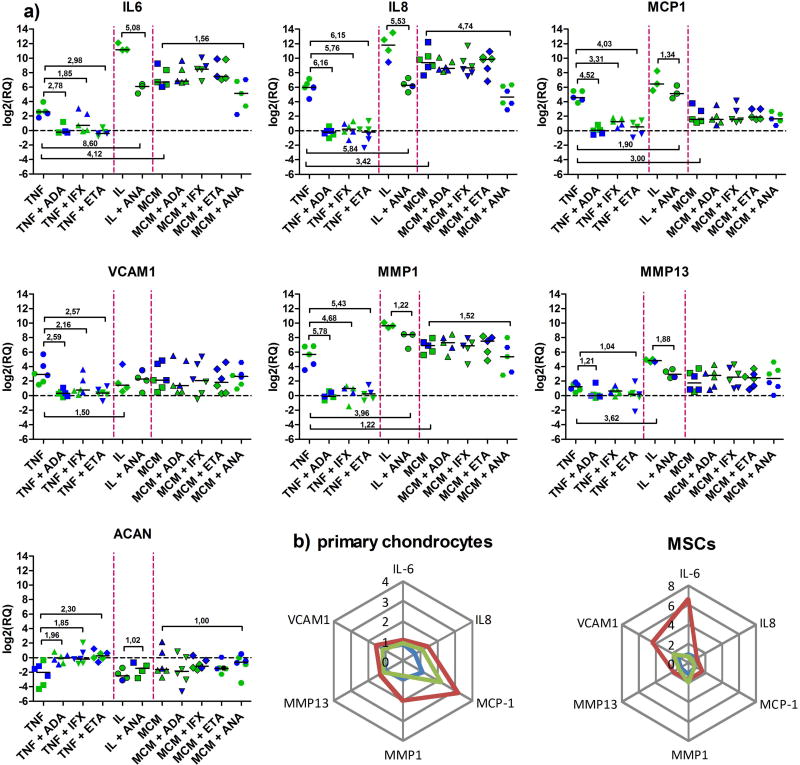
Figure 3. a) Gene expression profiles following the addition of inflammatory mediators TNF-α, IL-1β or MCMh.s. working solution and anti-inflammatory biological drugs adalimumab (ADA), infliximab (IFX), etanercept (ETA) and anakinra (ANA).
Blue and green dots represent values obtained in microspheroid chondral tissues made of MSCs and OACs (3 donors), respectively. Statistically significant changes, i.e. log2(RQ) ≥ 1 and ≤ −1 have been outlined; median values of all groups are also shown. b) Radar graphs representing anti-TNF-α neutralization efficacies of ADA (blue), IFX (red) and ETA (green). Mean RQ values of three biological samples are shown for OAC- and MSC-derived microspheroids. Value 0 represents total inhibition of gene expression.

