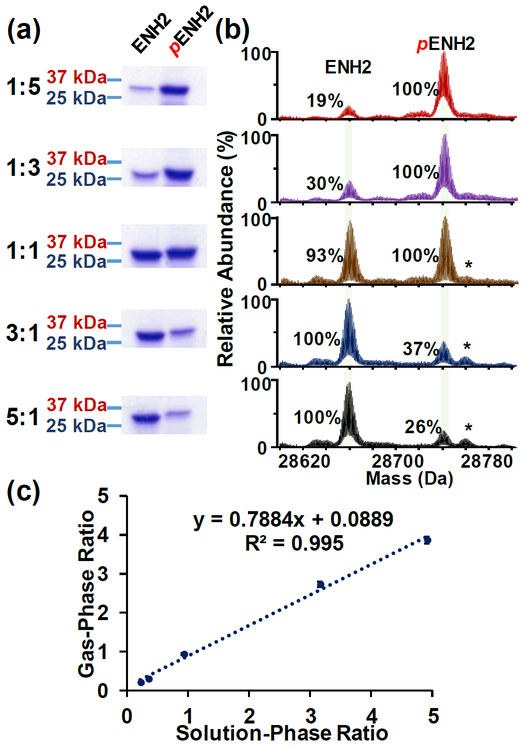
Figure 1. Protein quantification using SDS-PAGE gel analysis and maXis II Q-TOF MS analysis for ENH2.
(a) SDS-PAGE analysis of ENH2:pENH2 in five different ratios, 1:5, 1:3, 1:1, 3:1 to 5:1 (top to bottom) and (b) the corresponding Q-TOF MS deconvoluted spectra. Relative abundance is normalized to the most abundant species in each mass spectrum. (c) Correlation analysis between gas-phase ratios (derived from the Q-TOF MS data) and solution-phase ratios (derived from SDS-gel data) of ENH2:pENH2 suggests a linear correspondence between these two methods. *ENH2 with non-covalent phosphate adduct (+98 Da).

