
Figure 6.
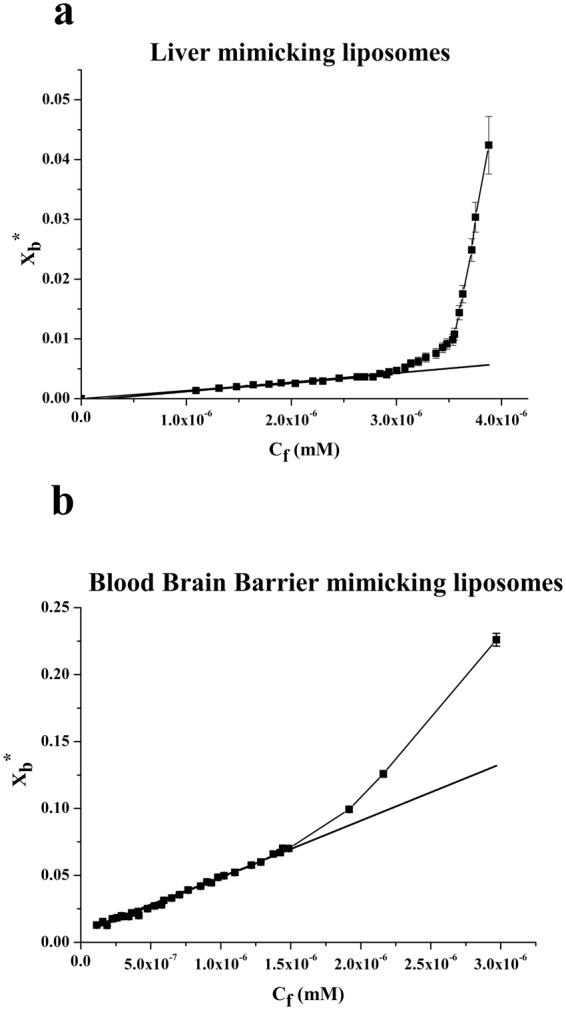
Binding isotherms in LUVs mimicking liver and BBB obtained plotting Xb* versus Cf for gH625 the peptide concentration for the spectra is 4 μM and the lipid/peptide ratio is 200.
Official websites use .gov
A
.gov website belongs to an official
government organization in the United States.
Secure .gov websites use HTTPS
A lock (
) or https:// means you've safely
connected to the .gov website. Share sensitive
information only on official, secure websites.
Binding isotherms in LUVs mimicking liver and BBB obtained plotting Xb* versus Cf for gH625 the peptide concentration for the spectra is 4 μM and the lipid/peptide ratio is 200.