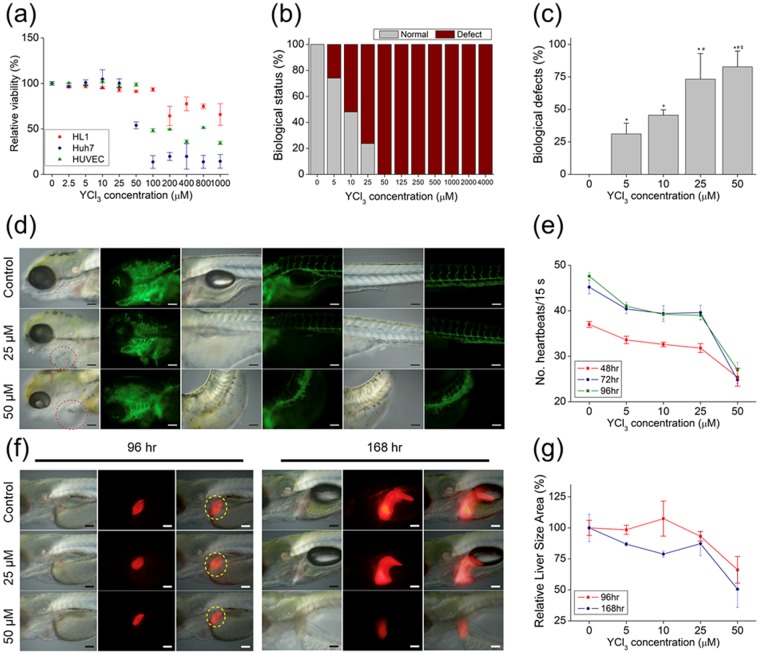
Figure 4.
Biological effect of Y3+ in vitro and in a zebrafish model. (a) Viability of HL-1 and Huh7 cells and HUVECs after treatment with indicated ion solutions for 12 h. (b) Biological status of embryos (normal or defective) at 6 hpf after treatment with indicated ion solutions. (c) Biological defects in embryos at 6 hpf after treatment with indicated ion solutions. (d) Representative images of ion-treated zebrafish embryos used to determine heart rate. (e) Mean heart rate of zebrafish embryos following 48-, 72-, and 96-hpf treatments with indicated concentrations of Y3+. (f) Representative images of ion-treated zebrafish embryos used to determine liver size at 96 and 168 hpf. (e) Mean liver size of zebrafish embryos following 96- and 168-hpf treatment with indicated concentrations of Y3+. *, #, &, and +, Significant difference vs. 0, 5, and 10 μM Y3+ ion, respectively.

