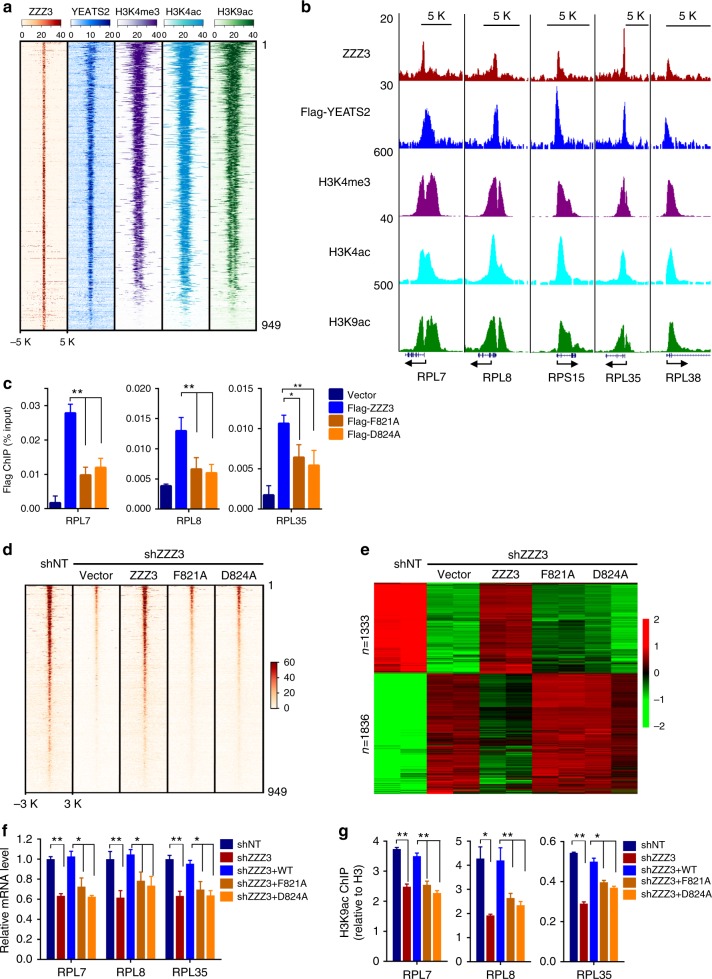
Fig. 4.
ZZZ3 is required for ATAC-mediated H3K9 acetylation and gene activation. a Heatmaps of the ZZZ3, Flag-YEATS2, H3K4ac, H3K9ac, and H3K4me3 ChIP-seq signals centered on ZZZ3 binding sites in a ± 5-kb window. Loci were classified as ZZZ3 peaks enriched with active promoter marks and others without active promoter marks. The color key represents the signal density. b Representative genome-browser views of ZZZ3 (red), YEATS2 (blue), H3K4me3 (purple), H3K4ac (cyan), and H3K9ac (green) ChIP-seq signals. TSS is indicated by an arrow. c qPCR analysis of Flag-ZZZ3 ChIP on gene promoters in cells stably expressing Flag-tagged WT ZZZ3 or the indicated point mutants. d Heatmap of the normalized ZZZ3 ChIP-seq signal densities in control (shNT), ZZZ3 KD (shZZZ3) cells, and KD cells ectopically expressing shRNA-resistant WT ZZZ3 or the indicated mutants. The signal is centered on ZZZ3 binding site in a ± 3-kb window. e Heatmap representation of differentially expressed genes in cells as in d from two biological replicates of RNA-seq experiments. Fisher’s exact test was used to define differentially expressed genes (q < 0.01). The color key represents normalized Log2 expression values. f qRT-PCR analysis of the expression of the indicated ribosomal protein genes in control (shNT), ZZZ3 KD (shZZZ3) cells, and KD cells ectopically expressing shRNA-resistant WT ZZZ3 or the indicated mutants. g qPCR analysis of H3K9ac ChIP on a promoter of the indicated ribosomal protein genes in cells as in f. Error bars represent s.e.m. of three biological replicates. ∗p < 0.05; ∗∗p < 0.01 (two-tailed unpaired Student’s t-test)

