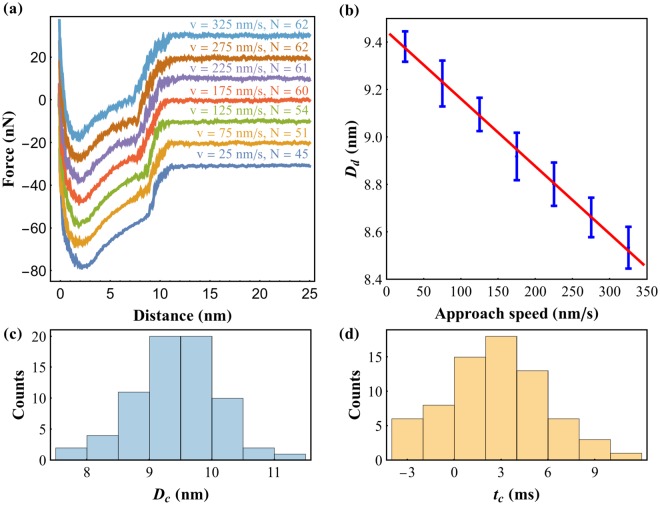
Figure 2.
Capillary bridges probed with Force Feedback Microscopy: (a) average force-distance curve acquired at each speed, shifted vertically for clarity. A clear reduction of the capillary nucleation distance is observed. Approach velocity and number of curves averaged are written above each curve; (b) average detected nucleation distance dependence on the tip-sample approach speed. A linear relation between the two was found. Error bars represent the standard deviation of the mean of the nucleation distance for each speed; The analysis of each series of force-distance curves yields individual values of Dc and tc, which results in histograms of the critical nucleation distance (c) and the condensation time (d).

