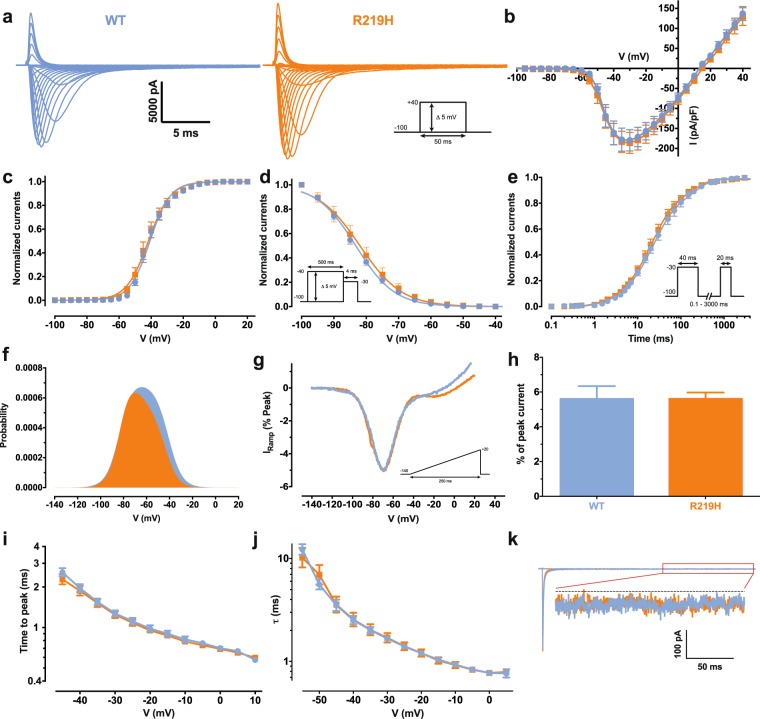
Figure 2.
Biophysical characterization of the Nav1.5 channels from WT and patient specific hiPSC-CMs. The data of the Nav1.5 WT channel are indicated by blue symbols, those for the R219H mutant channel by orange symbols. (a) Representative whole–cell current traces of the WT and mutant channels. Currents were elicited using a voltage–clamp protocol where depolarizing pulses were applied for 50 ms from −100 to + 40 mV in 5 mV increments (see protocol in inset). (b) Current density–voltage (I–V) relationship of the Nav1.5/WT and R219H channels. (c) Voltage–dependence of steady–state activation of the WT and mutant channels. Activation curves were generated using a standard Boltzmann distribution [G(V)/Gmax = 1/(1 + exp(−(V −V1/2)/k))] to give the V1/2 and k values listed in Table S2 of the article. (d) Steady state inactivation of the WT and mutant channels. Inactivation currents were obtained by applying conditioning pre–pulses to membrane potentials ranging from a holding potential of −100 to −40 mV for 500 ms in 5–mV increments and were then measured using a 4–ms pulse to −30 mV at each step (see protocol in inset). The recorded inactivation values were fitted to a standard Boltzmann equation [I(V)/Imax = 1/(1 + exp((V − V1/2)/k)) + C] to give the values listed in Table S5 of the article. (e) Recovery from fast inactivation was obtained using a two–pulse protocol at + 30 mV to obtain maximal activation (see protocol in inset). The time constants listed in Table S2 of the article were obtained using a two–exponential function: (Afast(1 − exp(−t/τfast)) + Aslow(1 − exp(−t/τslow)) + C). (f) The overlap between activation and inactivation defines the window current. The predicted window current was obtained using the following equation: (1/(1 + exp((V1/2activation–V)/kactivation)) × ((1–C)/(1 + exp((V − V1/2inactivation)/kinactivation)) + C). (g) Ramp protocols (see protocol in inset) were imposed to study the window current. As predicted in A, the window currents of the mutant channels is not different from WT channels. (h) Histogram showing the peak window current normalized to the alpha peak current (% of peak current). (i) The times to peak of the WT and mutant channels were used to evaluate the activation kinetics. The times to peak were measured on the same current traces used to construct the I–V relationship. (j) The time constants of fast inactivation decay were plotted as a function of voltage for the WT and mutant channels. The time constants were obtained using a simple–exponential function: (Afast(exp(−t/τ) + C). (k) Representative current traces after a −30 mV depolarizing pulse indicating a similar persistent Na+ current from Nav1.5 WT and R219H channels. The persistent Na+ current is measured at the end of the 400–ms depolarizing pulse to give the values listed in Table S2.

