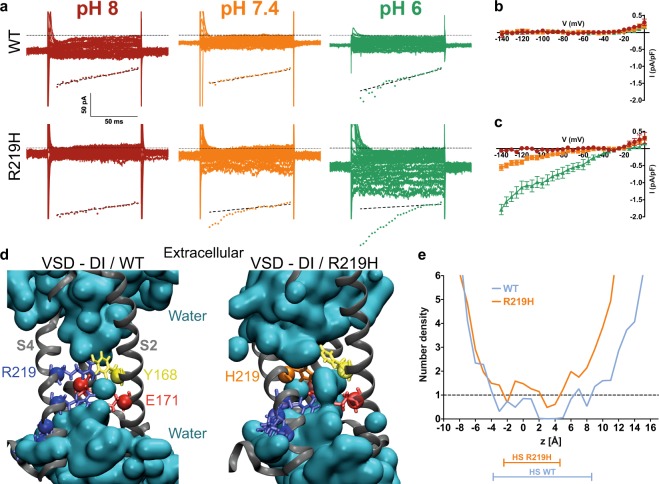
Figure 3.
The Nav1.5/R219H mutation opens a proton specific gating pore. (a) Gating pore currents were recorded from a holding potential of −80 mV using a voltage-step protocol from −140 to 0 mV in 5-mV increments. The top panels show examples of raw traces of gating pore currents for each hiPSC cell line (WT or Nav1.5/R219H hiPSC-CMs). The currents are also plotted as a function of voltage in the bottom panels. Linear non-specific leaks are indicated by dotted lines. The patient specific hiPSC-CM carrying the Nav1.5/R219H mutation generates a gating pore current that is not observed with the WT hiPSC-CM. The gating pore is open at hyperpolarized potentials and specifically conducts protons. (b,c) Current density-voltage relationships of gating pore currents recorded for the WT hiPSC-CM (b) and R219H hiPSC-CM (c) are shown (n = 6 for WT and n = 7 for R219H). (d) Structural models of the relaxed domain I (DI) VSD of the WT Nav1.5 (left) and the R219H mutant (right). The VSD protein backbone is represented as a grey ribbon. For the purpose of clarity, the S1 segment of the VSD has been removed. The gating charges of S4 and the counter charges of S2 and S3 are shown using standard colors (positive charges in blue, negative charges in red, aromatic residues in yellow, and the histidine 219 in orange). In the middle panel, the water-accessible volume is shown as a transparent cyan surface. (e) Water density profiles along the main axis of the VSD WT (blue) and R219H (orange). The histograms were built using a 1–Å grid, and the averages were calculated from the last 10 ns of the trajectories. 0 corresponds to the position of the Cα of Y168 of S2. The hydrophobic septum (HS) for each VSD is determined by a water density below 1.

