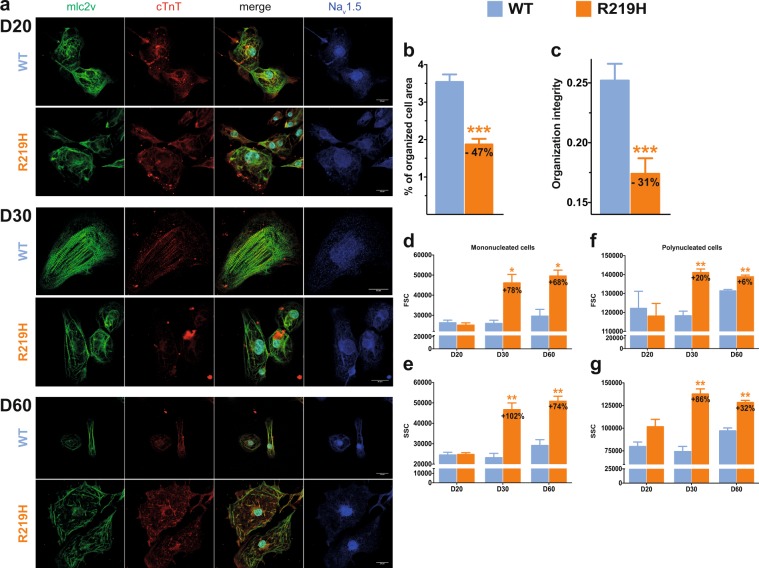
Figure 4.
hiPSC-CM morphology and sarcomeric organization. The results for the WT hiPSC-CMs are indicated in blue, those for the R219H hiPSC-CMs are in orange. (a) Immunocytochemistry of the WT and Nav1.5/R219H hiPSC-CMs at D20 (top), 30 (middle) and 60 (bottom) of differentiation. The first column of each panel represents myosin light chain 2 v staining (mlc2v, green) and the second column represents cardiac troponin T staining (cTnT, red). The third column shows the merger of columns one and two with the DAPI nuclear staining. For the WT hiPSC-CMs, the nucleus cannot be clearly seen due to the confocal image. The nucleus is just below, at the limit of the confocal section. The last column of each panel represents Nav1.5 channels (blue). (b,c) Contractile structural organization characteristics studied using AutoTT software54. The cell area covered by the mlc2v contractile protein (b) and organizational integrity (c) were evaluated. (d–g) FACS technique revealed two distinct hiPSC-CM populations comprising mononucleated cells and polynucleated cells (that are described in Figure S7). Histograms summarizing the size (forward scatter, FSC) and granularity (side scatter, SSC) of hiPSC-CMs (WT and R219H) at D20, D30, and D60 of differentiation evaluated using the FACS technique.

