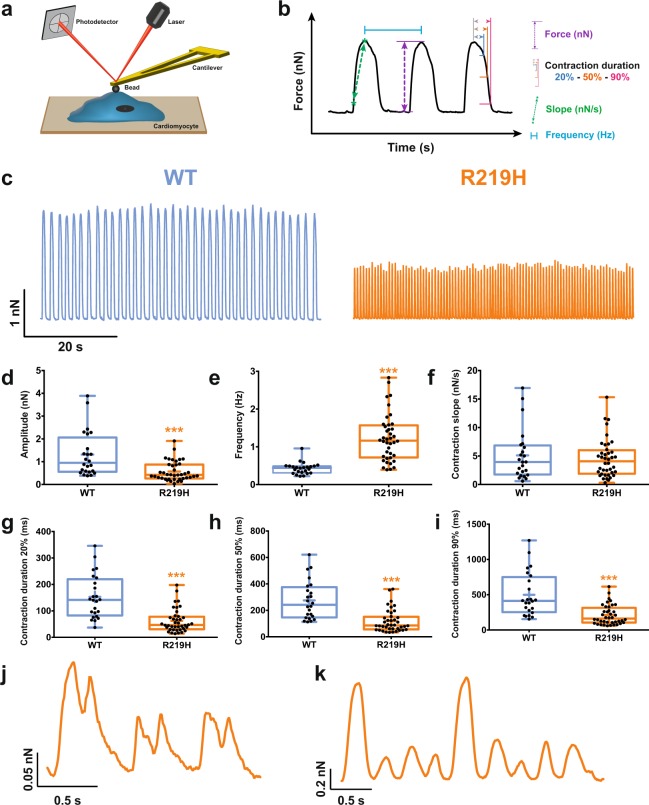
Figure 6.
Evaluation of hiPSC-CMs spontaneous contractile function by atomic force microscopy. The results for the WT hiPSC-CMs are indicated by blue symbols, and those for the R219H hiPSC-CMs by orange symbols. (a) Schematic representation of the atomic force microscope experimental setup used for the evaluation of contractile function. (b) Example of a magnified raw trace showing the different parameters measured on each trace. The contraction slope, the amplitude (force) and duration are evaluated. The contraction frequency is also evaluated. (c) Representative raw traces of contractile functions monitored using an atomic force microscope (AFM) for both hiPSC-CMs. (d–i) Whisker box plot of all contractile parameters. The means of individual cells (black dots), 25th, 50th, and 75th percentile quantiles (box) and the global mean (cross) are shown for each plot. The gating pore current caused a decrease in the contraction amplitude (d), an increase in the contractile frequency (e), and a shortening of the contraction duration (g–i). (j–k) Examples of chaotic contractions recorded for the R219H hiPSC-CMs. Asterisks indicate differences between WT hiPSC-CMs (***p < 0.001).

