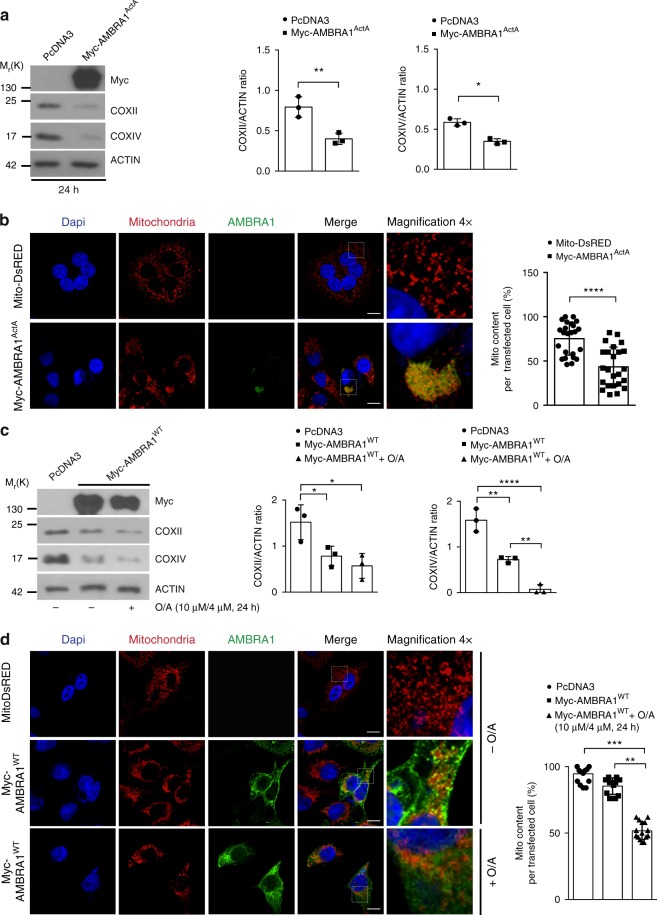
Fig. 2.
AMBRA1 expression rescues mitophagy induction in Penta-KO cells. a Penta-KO cells transfected with a vector encoding for Myc-AMBRA1ActA or an empty vector (PcDNA3) for 24 h were immunoblotted for the indicated antibodies; n = 3. b Myc-AMBRA1ActA (red) or Mito-DsRED (red) transfected Penta-KO cells were fixed after 24 h. Scale bar, 10 μm. The graph shows the mito content (%) in single transfected cells (±S.D.); n = 4. Mito-DsRED = 12 individual fields; Myc-AMBRA1ActA = 12 individual fields. c Penta-KO cells were transfected with vectors encoding Myc-AMBRA1WT or PcDNA3 and treated with O/A (10 μM and 4 μM, respectively) for 24 h. Mitochondrial markers levels, COXII and COXIV, were evaluated by western blot; n = 3. d Cells transfected with Mito-DsRED or with Myc-AMBRA1WT were immunostained with an anti-Myc (green) and anti-TOM20 (red) antibodies. Scale bar, 10 μm; n = 3. Mito-DsRED = 9 individual fields; Myc-AMBRA1WT = 9 individual fields; Myc-AMBRA1WT+O/A = 9 individual fields. *P < 0.05; **P < 0.01; ***P < 0.001; ****P < 0.0001. The quantification results are the mean of three independent experiments (±S.D.) if not otherwise stated. Statistical analysis was performed using Student’s t-test (a, b) or one-way ANOVA (c, d). Mr(K) = relative molecular mass expressed in kilodalton

