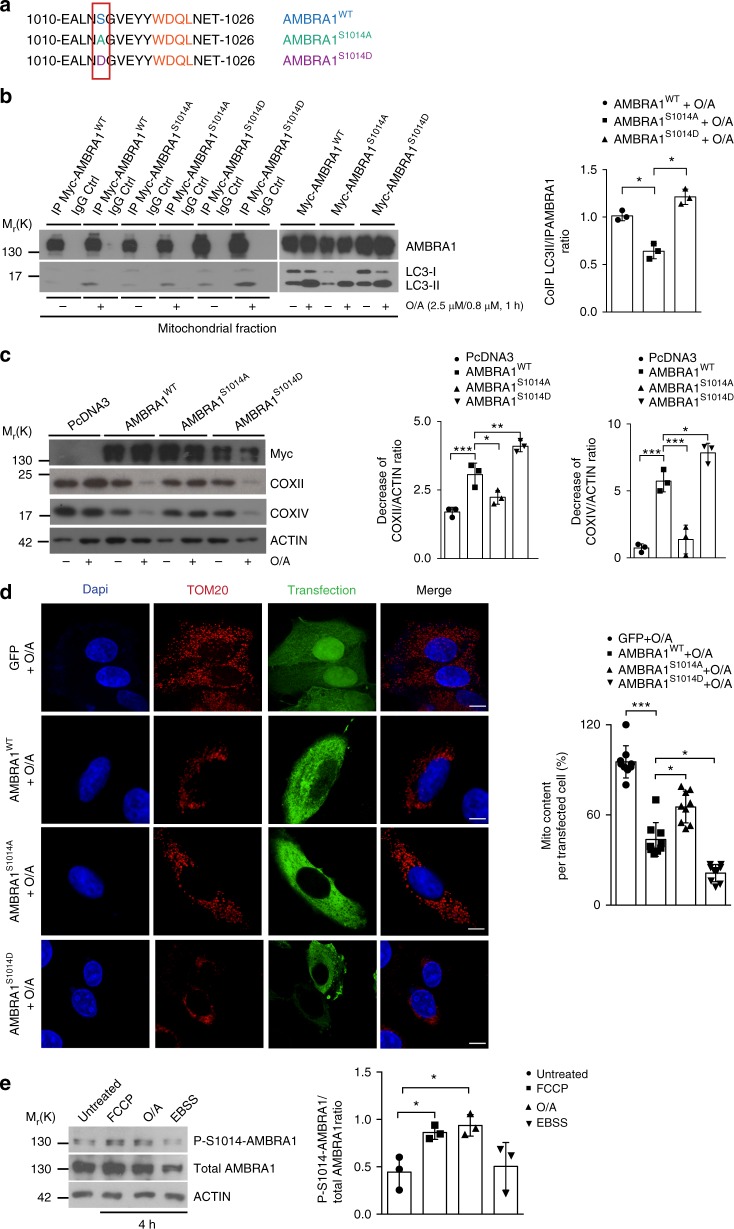
Fig. 3.
S1014-AMBRA1 phosphorylation is crucial for AMBRA1–LC3 interaction. a Sequence alignment of AMBRA1–S1014 site, flanking its LIR motif, in comparison with the S1014A (phospho-dead) and S1014D (phospho-mimetic) generated mutants. b HeLa transfected with Myc-AMBRA1WT, Myc-AMBRA1S1014A or Myc-AMBRA1S1014D were treated or not with O/A (2.5 μM, 0.8 μM, 1 h) and subjected to co-immunoprecipitation (Co-IP). The graph shows the ratio between Co-IP LC3II/IP-AMBRA1 upon mitophagy induction; n = 3. Statistical analysis was performed using Student’s t-test versus the wild-type form of AMBRA1. c PcDNA3, Myc-AMBRA1WT, Myc-AMBRA1S1014A or Myc-AMBRA1S1014D transfected HeLa cells were treated with O/A (2.5 μM, 0.8 μM, 4 h) and blotted for COXII, COXIV, Myc and ACTIN; n = 3. d Cells transfected with a vector encoding for GFP, Myc-AMBRA1WT, or Myc-AMBRA1S1014A or Myc-AMBRA1S1014D were treated with O/A as indicated above and stained with anti-Myc and anti-TOM20 (red staining) antibodies. Scale bar, 10 μm; n = 3. Myc-AMBRA1WT = 9 individual fields; Myc-AMBRA1S1014A = 9 individual fields; Myc-AMBRA1S1014D = 9 individual fields. e Untransfected HeLa cells were treated with mitophagy inducers, such as FCCP (10 μM) and O/A (2.5 μM and 0.8 μM) or with the starvation medium EBSS in order to induce autophagy for 4 h; n = 3. Data represent the mean of three different samples (±S.D.) and are representative of experimental triplicate. *P < 0.05; **P < 0.01; ***P < 0.001. Statistical analysis was performed using Student’s t-test (b) or one-way ANOVA (c, d, e). Mr(K) = relative molecular mass expressed in kilodalton

