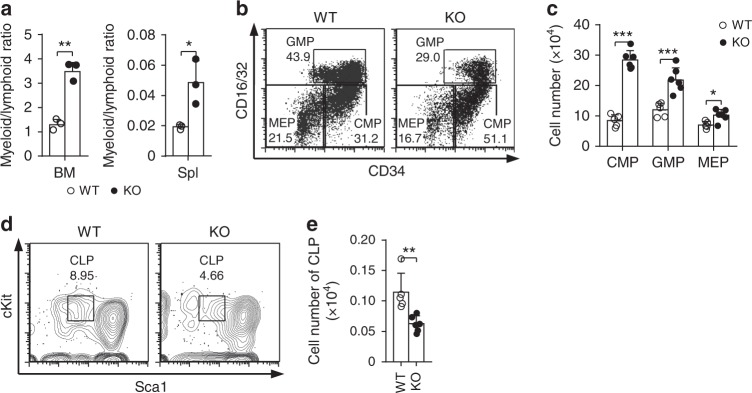
Fig. 2.
Loss of Med23 results in increased myeloid progenitors. a The ratio of myeloid cells to lymphoid cells in bone marrows (left) and spleens (right) of WT and KO mice (n = 3). b, c Representative dot plots Lin−CD127−cKit+Sca1− live cells (b) and cellularity (c) of common myeloid progenitors (CMPs), granulocyte-macrophage progenitors (GMPs) and megakaryocyte/erythroid progenitors (MEPs) in bone marrows of WT and KO mice (WT, n = 5; KO, n = 6). d, e Representative contour plots gating from Lin−CD127+ live cells (d) and cellularity (e) of CLPs in bone marrows of WT and KO mice (WT, n = 5; KO, n = 6). The data are means ± S.D., for all panels: *p < 0.05, **p < 0.01, ***p < 0.001 by Student’s t-test

