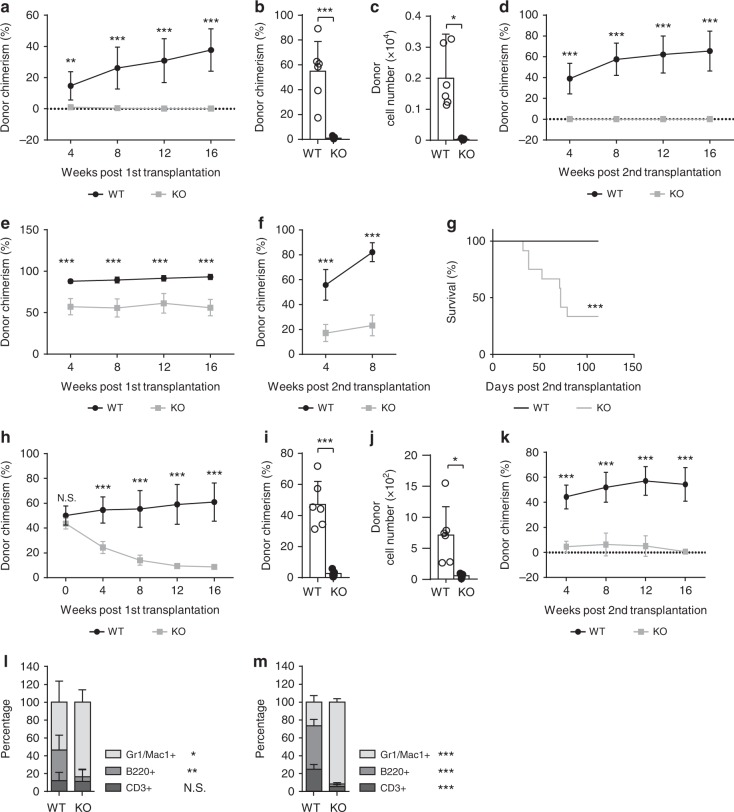
Fig. 4.
Impaired self-renewal potential in med23-deficient HSCs. a Donor chimerism of PBMC in primary recipients transplanted with 50 HSCs (CD45.2) from WT or KO mice, along with 500,000 bone marrow cells (CD45.1) (WT, n = 6; KO, n = 7). b, c Chimerism (b) and absolute cell number (c) of donor HSCs in primary recipients at 16 weeks post-transplantation (WT, n = 6; KO, n = 5). d Donor chimerism of HSCs in secondary recipients transplanted with 2,000,000 bone morrow cells from primary recipients, described in a (WT, n = 11; KO, n = 9). e Donor chimerism of PBMC in primary recipients transplanted with 2,000,000 total bone marrow cells (CD45.2) from WT or KO mice (WT, n = 9; KO, n = 8). f Donor chimerism of PBMC in secondary recipients transplanted with 2,000,000 bone morrow cells from primary recipients, described in e. g Kaplan–Meier survival curve of secondary recipients, described in f (n = 12). h Donor chimerism of PBMC in primary recipients transplanted with 1,000,000 bone marrow cells (CD45.2) of WT and KO mice, along with 1,000,000 bone marrow cells (CD45.1) followed by poly(I:C) administration at 4 weeks post-transplantation (WT, n = 8; KO, n = 7). i, j Chimerism (i) and absolute cell number (j) of donor HSCs in primary recipients at 16 weeks post-transplantation (WT, n = 6; KO, n = 5). k Donor chimerism of PBMC in secondary recipients transplanted with 2,000,000 bone morrow cells from primary recipients, described in h (WT, n = 8; KO, n = 9). l Percent of myeloid, B and T cells in peripheral blood of recipient mice, described in a at 16 weeks post-transplantation (n = 5). m Percent of myeloid, B and T cells in peripheral blood of recipient mice, described in e at 16 weeks post-transplantation (WT, n = 8; KO, n = 9). The data are means ± S.D., for all panels: *p < 0.05, **p < 0.01, ***p < 0.001 by Student’s t-test, N.S. no significance

