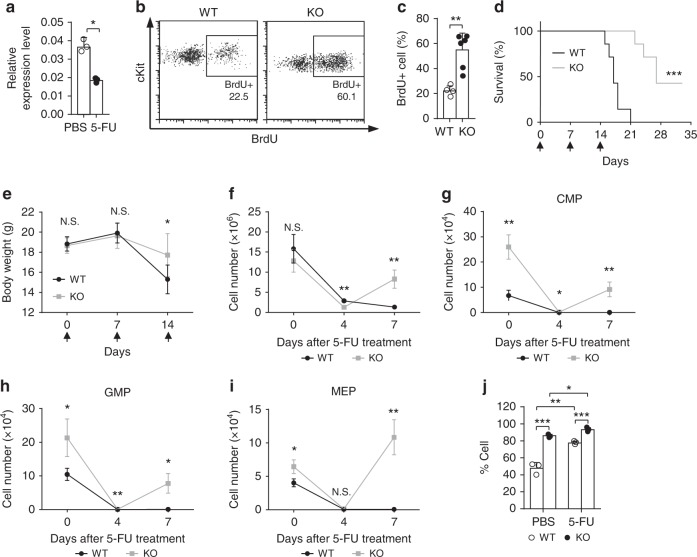
Fig. 6.
Shorter recovery period and better survival of Med23 KO mice under myeloablative stress. a Med23 expression in HSC (CD150+CD34−CD48−Lin−Sca1+) isolated from WT mice at 5 days post PBS or 5-FU injection (n = 3). b, c Representative dot plots (b) and percentages (c) of BrdU incorporated HSCs in WT and KO mice (WT, n = 3; KO, n = 4). d Kaplan–Meier survival curve of WT and KO mice at different time points after serial 5-FU injection. Arrow shows the time points for 5-FU injection (n = 7). e Body weights of WT and KO mice at different time points after serial 5-FU injection. Arrow shows the time points for 5-FU injection (n = 7). f Total bone marrow cells in WT and KO mice after single 5-FU injection (n = 3). g–i Absolute cell number of CMPs (g), GMPs (h), and MEPs (i) in WT and KO mice at different time points after single 5-FU injection (n = 3). j Percent of CD41+ cells in HSCs (CD34−CD150+CD48−Lin−Sca1+) from WT and KO mice at 7 days after single 5-FU or PBS injection (n = 3). The data are means ± S.D., for all panels: *p < 0.05, **p < 0.01, ***p < 0.001 by Student’s t-test, N.S. no significance

