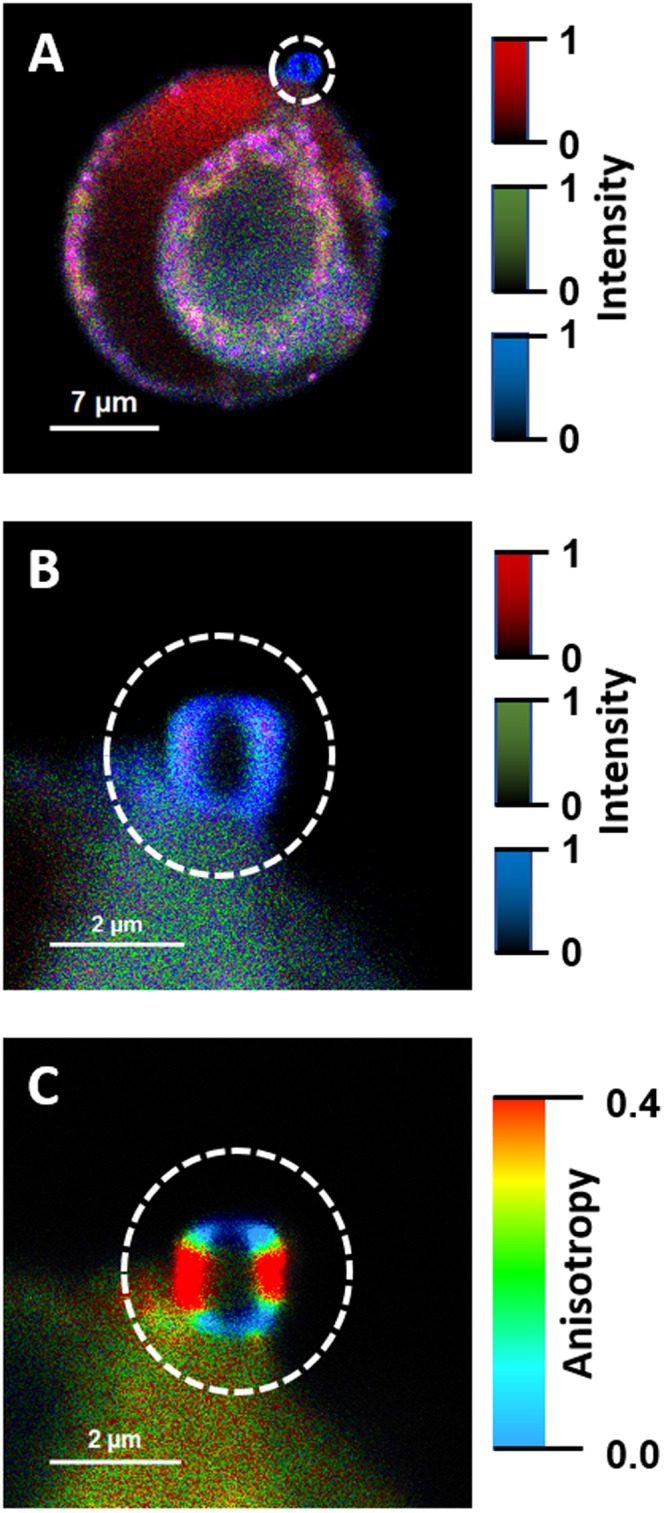
Figure 3.

Fluorescence lifetime and fluorescence anisotropy images of a single exosome. Panel A shows a cell from the HT-29 cell line, cultured at AmB concentration of 10 µg/ml. Panel B shows an image of a single exosome vesicle, selected in panel A (marked with a white circle) and recorded with higher resolution. Panel C shows the same exosome imaged based on fluorescence anisotropy data. The colour code for panels A and B as in Fig. 2. The relatively short fluorescence lifetimes of AmB in the exosome (panel B) is indicative of the formation of small aggregated forms of the drug in the lipid phase. The relatively high fluorescence anisotropy values at the left- and right-hand of the image of a vesicle cross-section (panel C) are consistent with the perpendicular orientation of AmB molecules with respect to the membrane plane.
