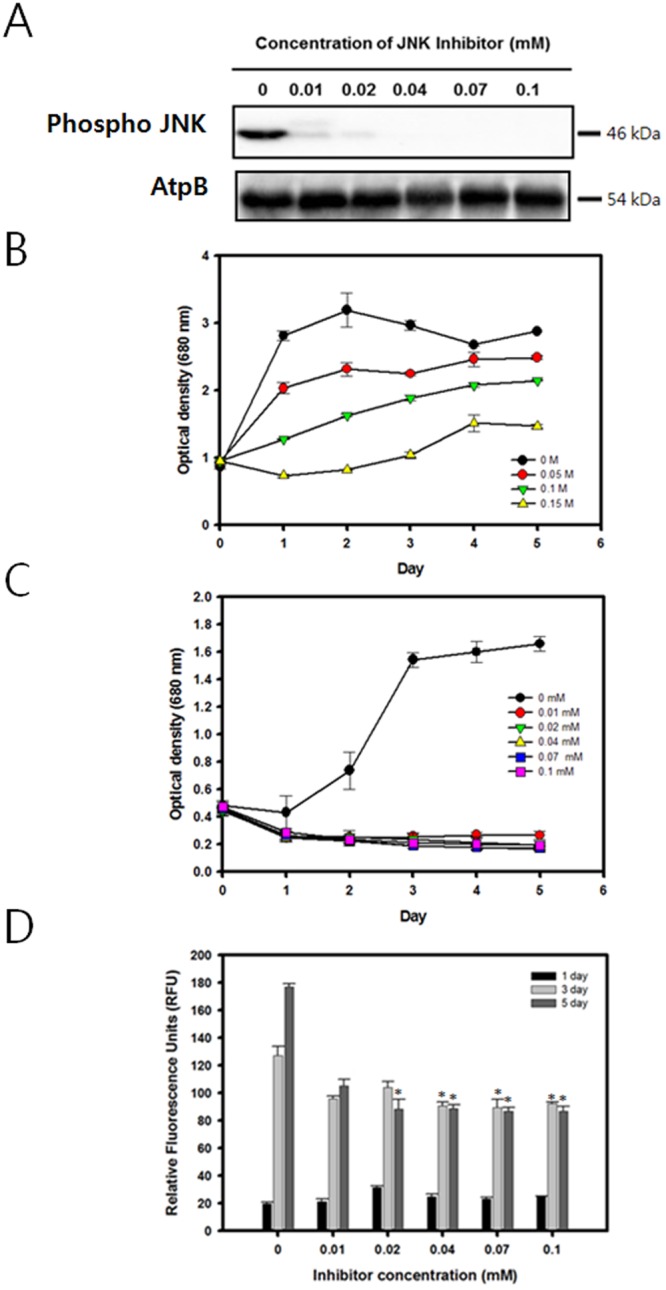
Figure 5.

The expression level of JNK and cell growth profile and lipid accumulation of C. reinhardtii grown in media containing 0.1 M NaCl with various concentrations of the JNK inhibitor SP600125. (A) Western blot analysis against anti-JNK. Full-length blots are presented in Supplementary Fig. S6. (B) Cell growth (O.D. 680 nm) without SP600125 (C) Cell growth (O.D. 680 nm) with various concentrations of SP600125. (D) Nile red fluorescence measurement at 3 and 5 days after osmotic stress induction. Data are represented as mean ± SD (n = 3). Significant differences were determined by Student’s t-test and indicated by asterisks (*P < 0.05, **P < 0.01, ***P < 0.001).
