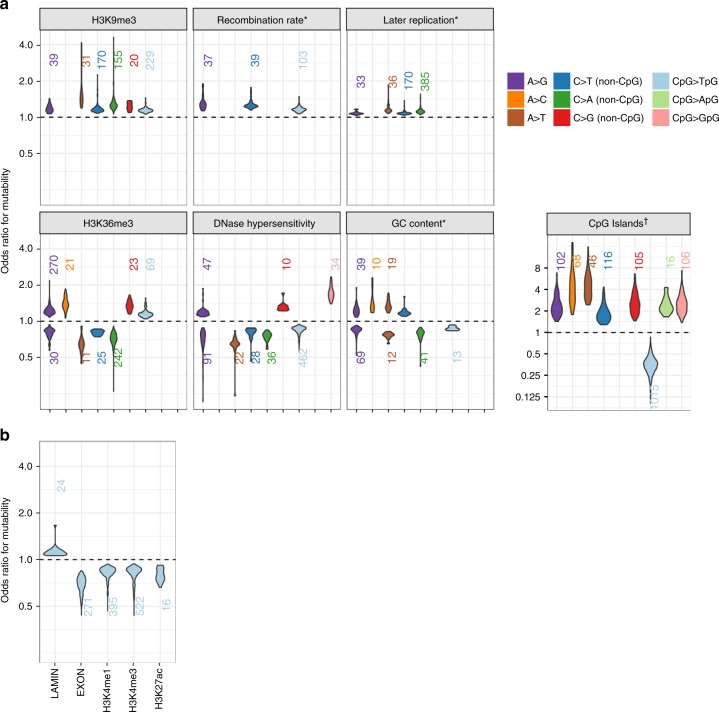
Fig. 3.
Distributions of statistically significant mutagenic effects of genomic features. a Effects of seven genomic features where associations with multiple mutation types were detected. For features with bidirectional effects, we separately plotted distributions of positive associations (OR > 1; above dashed line) and negative associations (OR < 1; below dashed line). The number of 7-mer subtypes within each type for which that feature is statistically significant in a positive or negative direction is shown above or below each distribution. Distributions are only shown for types with 10 or more 7-mer subtypes associated in the same direction. *Odds ratios for the three continuously valued features (recombination rate, replication timing, and GC content) indicate the change in odds of mutability per 10% increase in the value of that feature. †Effects in CpG islands tend to be stronger than other features, so are shown on a wider scale. b Distributions of significant mutagenic effects for the 5 features only associated with CpG > TpG transitions

