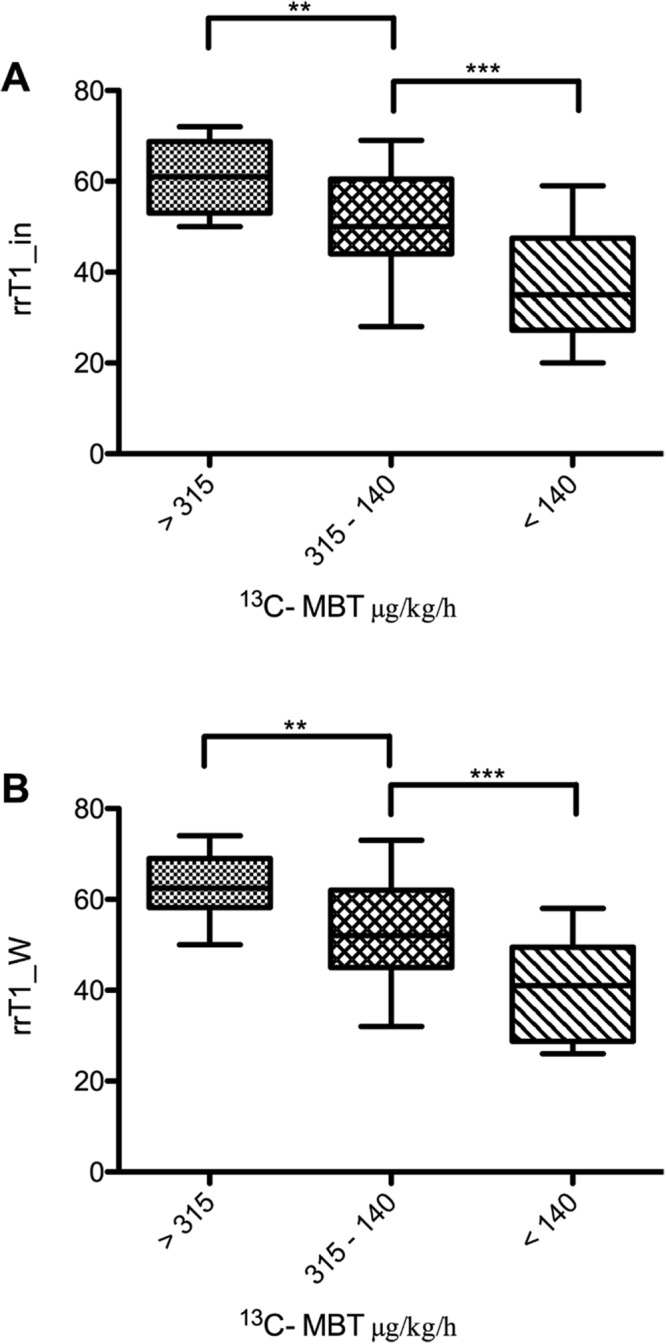
Figure 5.

Reduction rates of T1 relaxation time by 13C-MBT readouts in T1 maps without fat separation (rrT1_in; A) and water-only T1 maps with fat separation (T1_W; B). The difference in reduction rates of the T1 relaxation time is statistically significant between the first and third groups in T1 maps without fat separation (A: p < 0.001) as well as in T1 maps with fat separation (B: p < 0.001). The difference is also statistically significant from that of the second group, either in T1 maps without fat separation (A: p = 0.003) or water-only T1 maps (B: p = 0.002). Group two differs significantly from group three in T1 maps without fat separation (A: p < 0.001) and T1 maps with fat separation (B: p < 0.001). group 1 13C-MBT >315 [µg/kg/h]: normal liver capacity. group 2 13C-MBT 315-140 [µg/kg/h]: intermediate liver capacity. group 3 13C-MBT <140 [µg/kg/h]: severe impaired liver capacity. Data are shown as the mean T1 reduction rates ± standard deviation. **p < 0.01, ***p < 0.001.
