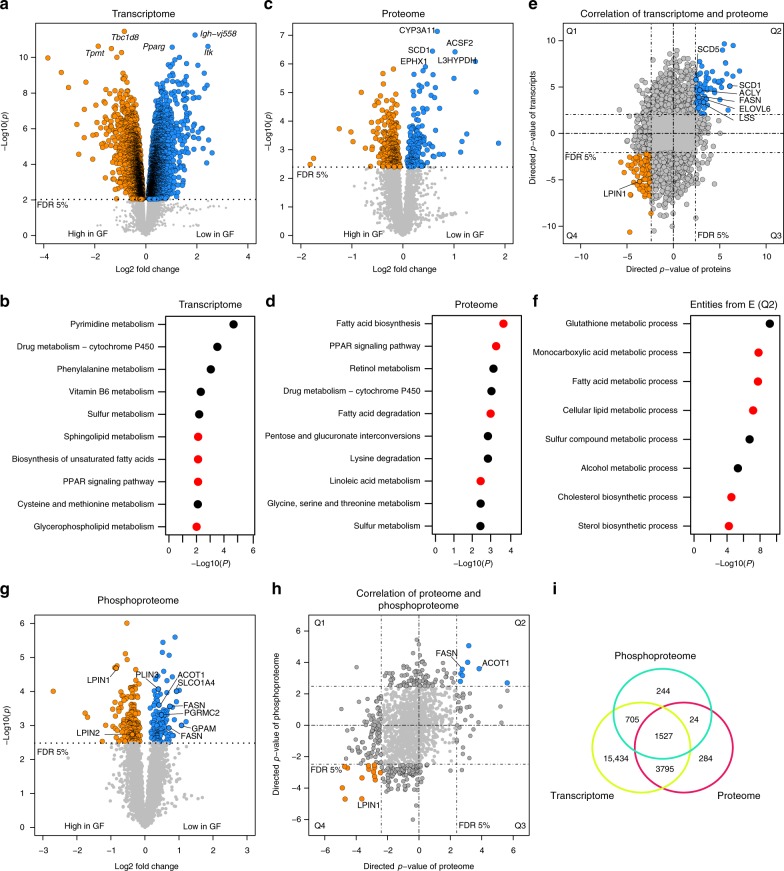
Fig. 1.
Transcriptomic, proteomic, and phosphoproteomic analyses of liver samples from SPF and GF mice. a Transcriptome data analyzed by t-tests, (n = 6/6). b KEGG pathway enrichment on transcriptome data. c Proteome data, analyzed by t-tests, (n = 5/5). d KEGG pathway enrichment in proteome data. e Transcriptome–proteome correlation. f GO enrichment analysis for biological processes of Q2 from e. g Phosphoproteome analyzed by t-tests, (n = 5/5). h Proteome–phosphoproteome comparison. i Venn diagram showing the overlap of detected genes, proteins, and phosphoproteins. e, h Q1, Q2, Q3, and Q4 mark the quadrants of the correlation plots; directed p-values are defined as–log10 (p) times the direction of the effect. b, d, f Red dots indicate lipid-related pathways. FDR: false discovery rate, GF: germfree, SPF: specific pathogen-free

