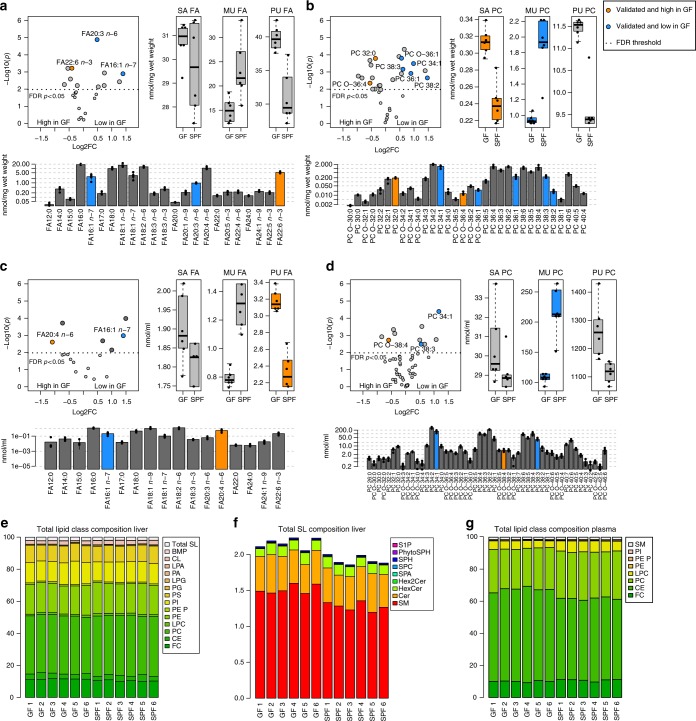
Fig. 2.
Quantitative lipidome analyses of liver and plasma from GF and SPF mice. Data from experiment 1 are shown (n = 6/6). Candidates verified in experiment 2 (SPF: n = 14; GF: n = 12) are displayed in blue (high in SPF) or orange (high in GF). a Total fatty acids (FA) in liver. b PC species in liver. c Total FA in plasma. d PC species in plasma. a–d Volcano plots: significance and log2 fold change in individual lipid species; boxplots: concentrations of saturated (SA), monounsaturated (MU), and polyunsaturated (PU) lipid species in GF and SPF mice; barplots: molecular lipid species profile of GF animals. In boxplots the thick lines represent the medians, the upper and lower lines of the boxes show the 25 and 75% quartiles and the whiskers are 1.5 times the interquartile range of the data. Error bars in the bar plots show the standard deviation. e Lipid class composition of liver samples, experiment 1. f Sphingolipid composition of liver samples, experiment 1. g Lipid class composition of plasma, experiment 1. GF: germfree, PC: phosphatidylcholine (diacyl), PC: O phosphatidylcholine (alkyl-acyl), SPF: specific pathogen-free, for other abbreviations, see Table 1

