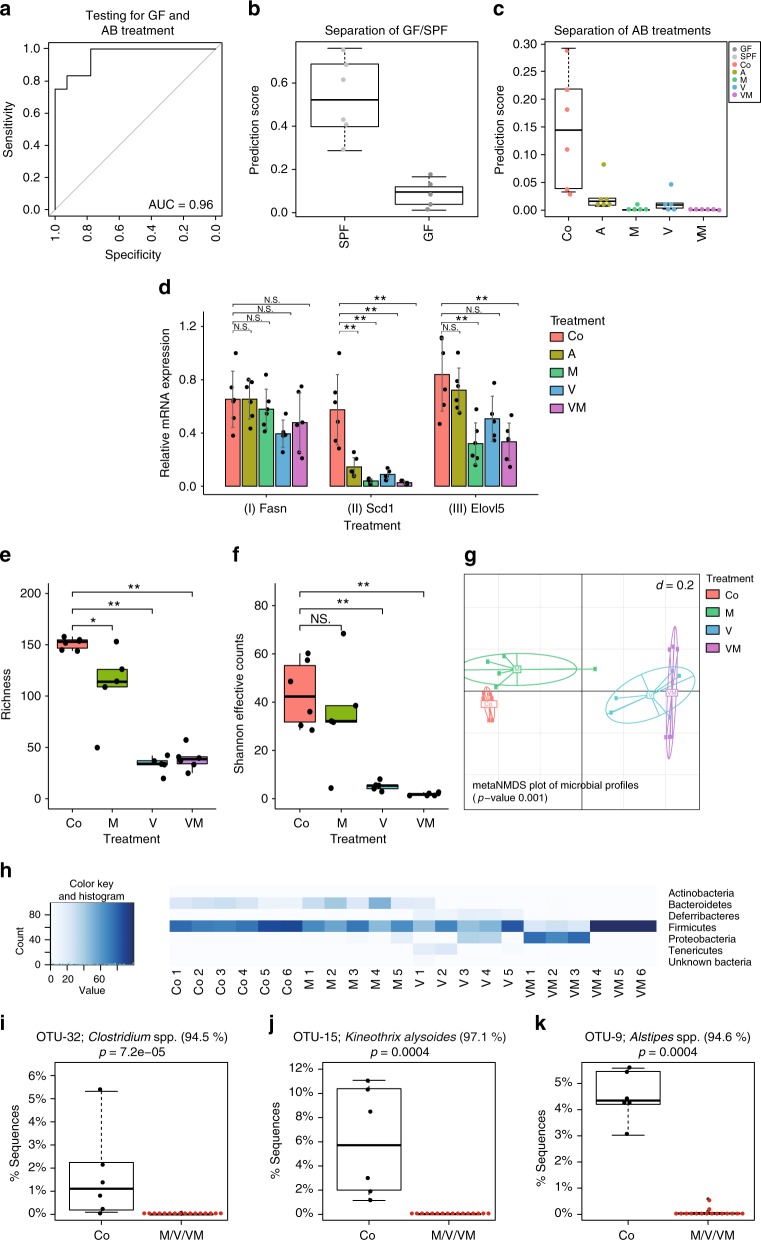
Fig. 4.
Effect of antibiotics on hepatic FA metabolism and association of cecal microbial species with FA metabolic consequences. SPF mice were treated with ampicillin (A, n = 6), metronidazole (M, n = 5), vancomycin (V, n = 6) or a combination of V and M (VM, n = 6). a Classification sensitivity and specificity of the calculated score separating GF and antibiotic-treated from the SPF mice. b Score for GF and SPF mice (GF: n = 5, SPF: n = 5) from a third experiment to validate the classification score. c Score for antibiotic-treated and untreated mice. d Relative mRNA expression of Fasn, Scd1, and Elovl5, mean and standard deviation are shown. e Alpha-diversity analysis shown as richness counts, and f Shannon effective counts. Samples from A-treated mice reproducibly generated too few sequences and thus could not be included in 16 S rRNA gene amplicon analysis. g Multidimensional scaling showing differences in the phylogenetic makeup of microbiota between samples (β-diversity) based on general UniFrac distances. h Microbiota composition at the phylum level. i-k Most significantly different OTUs after a Kruskal–Wallis analysis in untreated compared to antibiotics treated mice. N.S.: not significant, OTU: operational taxonomic unit. In boxplots the thick lines represent the medians, the upper and lower lines of the boxes show the 25 and 75% quartiles and the whiskers are 1.5 times the interquartile range of the data. In barplots the error bars show the standard deviation

