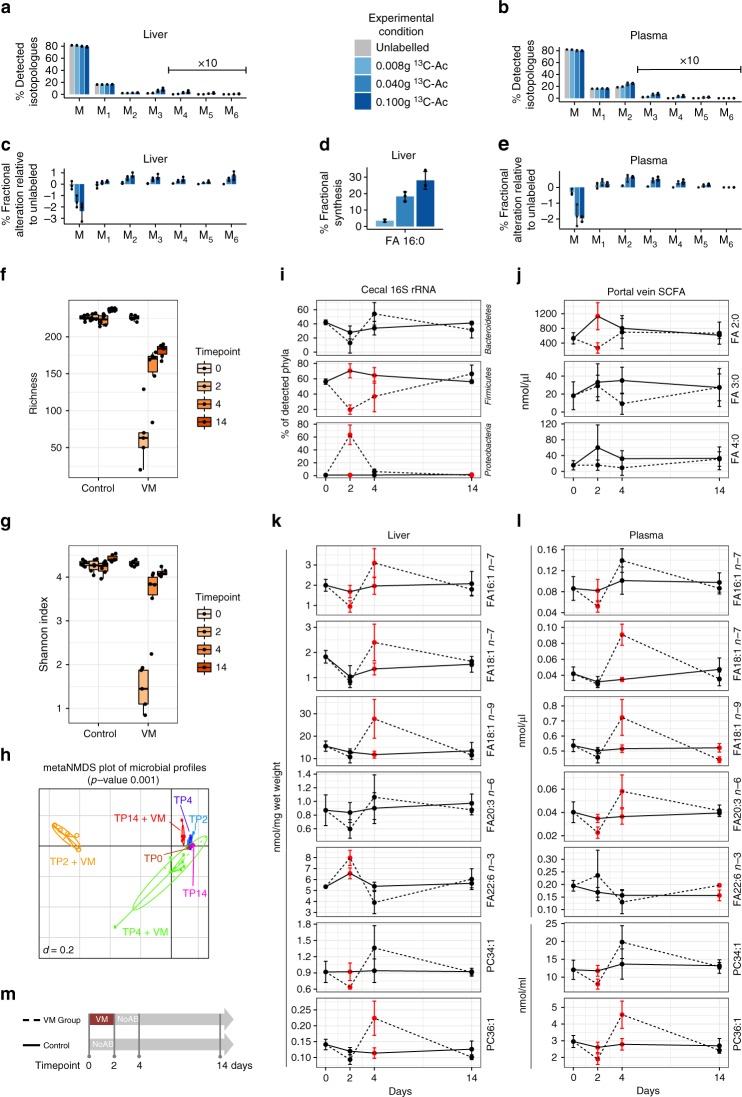
Fig. 5.
Fiber-derived FA 2:0 is precursor for hepatic synthesis of fatty acids and glycerophospholipids. SPF mice were supplemented with 13C-FA 2:0 via oral gavage with the indicated amount (n = 3/group), samples were taken 4 h after gavage. a Isotopologue distribution of FA 16:0 in liver and b plasma. c Fractional alterations (%) of M0, M1–M6 isotopologues relative to unlabeled control in liver and e plasma. d Fraction of de novo synthesized FA 16:0 in liver. SPF mice were treated for 2 days with VM (TP2), additional 2 (TP4) or 10 days (TP14) without antibiotics (n = 6/TP); control SPF mice did not receive antibiotics (n = 6/TP). f Alpha-diversity analysis shown as richness counts and g Shannon effective counts. h Multidimensional scaling showing differences in the phylogenetic makeup of microbiota between samples (β-diversity) based on general UniFrac distances. i Composition of major phylas determined in cecum content. j Portal vein SCFA levels. k Levels of selected MUFA, PUFA and MUPC in liver and l plasma. AB: antibiotics, Ac: acetate, VM: vancomycin in combination with metronidazole. Red dots and error bars in i–l indicate a significant difference (p < 0.05) between the control and VM group. m Experimental setup for the antibiotics experiment. In boxplots the thick lines represent the medians, the upper and lower lines of the boxes show the 25% and 75% quartiles and the whiskers are 1.5 times the interquartile range of the data. In barplots the error bars show the standard deviations. The dot plots in i–l show the mean and the standard deviation per group and condition

