Figure 1.
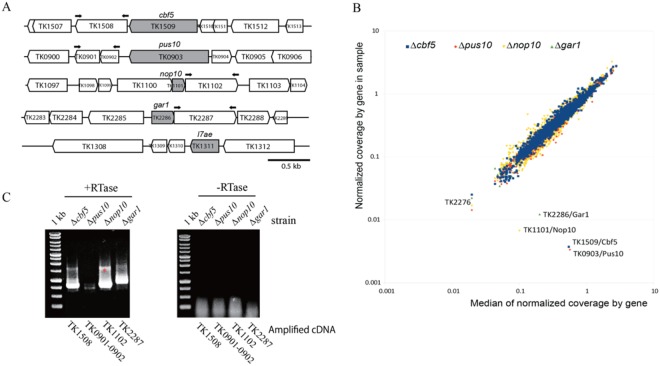
Construction of disruption mutants. (A) Schematic diagram of the loci targeted for disruption. The target genes are in gray. The black arrows indicate the primers for RT-PCR analysis (panel C and Table S3). (B) Normalized reads’ coverage as a function of the median coverage observed for all four deleted T. kodakarensis strains. Colors correspond to the coverage observed for ΔTK1509/cbf5 (blue), ΔTK0903/pus10 (red), ΔTK1101/nop10 (yellow) and ΔTK2286/gar1 (green) strains. Identity of outlier points is indicated. TK2276 (pyrF) is affected in all four strains analyzed. (C) Disruption of each targeted ORFs does not impair transcription of their respective downstream contiguous ORF. RT-PCR reactions (gel + RTase) were performed with oligonucleotide primers (Table S3) complementary to the coding sequence of the target gene’s adjacent ORFs (indicated below each lane). The RT-PCR products were fractionated by 0.8% agarose gel electrophoresis. The bands correspond to RNA amplification since no amplified products were obtained in a reaction mixture lacking reverse transcriptase (-RTase). The asterisk indicates non-specific amplification.

